
Dallas County’s four freestanding inpatient rehabilitation facilities operate 253 beds at an implied 84% combined occupancy, and three of the four earned positive operating margins in their latest reporting periods. This analysis examines facility financial performance, the accelerating shift to Medicare Advantage, patient-origin territories, and the most supportable opportunities for bed expansions, new facilities, and hospital joint ventures.
Evaluating a rehabilitation facility project? See our rehabilitation and therapy facility feasibility studies — independent, lender-grade analysis for operators, health systems, investors, and lenders.
Want this analysis for your own market? Order a custom hospital or healthcare facility market report for any county or state — from $1,950, delivered in 3–5 business days.
Firm-wide engagement figures are distinct from project-specific findings and their stated source periods.
Dallas County’s freestanding inpatient rehabilitation market is compact, heavily utilized, and financially uneven. The July 2026 dataset covers four Medicare-certified freestanding inpatient rehabilitation facilities (IRFs): Baylor Scott & White Institute for Rehabilitation – Dallas, Encompass Health Rehabilitation Hospital of Dallas, Mesquite Rehabilitation Institute, and Methodist Rehabilitation Hospital. Together they operate 253 licensed rehabilitation beds and reported 5,103 discharges and 77,733 inpatient days in their latest cost-report periods — an implied combined occupancy of 84.2%.
Demand is supported by roughly 2.6 million county residents and a senior population approaching 300,000, within the Dallas–Fort Worth metroplex of more than 8 million people — the largest metropolitan area in Texas. Rehabilitation demand is driven by stroke, neurological conditions, joint replacement, hip fracture, and other conditions concentrated in the 65-and-older population.
The market is not uniformly open. Occupancy above 85% at two facilities points to capacity pressure, while the payer environment is shifting rapidly toward Medicare Advantage, which now accounts for roughly 28.5% of combined Medicare discharges — up from about 22.9% four federal fiscal years earlier.
Key finding: Dallas County’s freestanding rehabilitation capacity is running near practical limits, and the most supportable strategies are bed expansion at constrained facilities, a carefully sited western or northwestern county project, specialty program differentiation, and hospital joint ventures — with Medicare Advantage contracting now a first-order feasibility question.
| Indicator | Market result |
|---|---|
| Freestanding inpatient rehabilitation facilities | 4 |
| Licensed rehabilitation beds | 253 |
| Combined discharges (latest cost-report periods) | 5,103 |
| Combined inpatient days | 77,733 |
| Implied combined occupancy | 84.2% |
| Combined net patient revenue | $280.3 million |
| Facilities with positive operating margins | 3 of 4 |
| Estimated county population | ≈2.6 million |
| Medicare Advantage share of Medicare discharges (FY 2025) | ≈28.5% |
The Dallas County freestanding rehabilitation market is healthy from a demand and utilization perspective, but uneven financially and increasingly exposed to Medicare Advantage payment pressure.
Five forces define the market’s condition: sustained demographic demand, capacity utilization near practical limits, wide variation in facility operating margins, the accelerating shift from traditional Medicare to Medicare Advantage, and a favorable Texas regulatory environment with no certificate-of-need barrier. Each is examined below.
Inpatient rehabilitation is a large, structurally supported segment of post-acute care. Roughly 1,200 inpatient rehabilitation facilities operate nationally, and MedPAC has repeatedly reported that freestanding IRFs earn substantially higher Medicare margins than hospital-based rehabilitation units — a pattern consistent with the profitable freestanding facilities in this dataset. For federal fiscal year 2026, CMS finalized a net payment increase of approximately 2.6% under the IRF prospective payment system.
Two regulatory requirements shape every rehabilitation facility’s feasibility:
Texas imposes no certificate-of-need requirement, so market entry is governed by licensure, Medicare certification, capital, and competitive dynamics rather than regulatory approval of need. That lowers barriers for new entrants — and equally for competitors responding to a new project.
The four facilities and their latest-period utilization are summarized below.
| Facility | City | Beds | Discharges | Inpatient days | Implied occupancy |
|---|---|---|---|---|---|
| Baylor Scott & White Institute for Rehabilitation – Dallas | Dallas | 113 | 1,620 | 32,941 | 79.9% |
| Encompass Health Rehabilitation Hospital of Dallas | Dallas | 60 | 1,518 | 19,032 | 86.9% |
| Mesquite Rehabilitation Institute | Mesquite | 30 | 647 | 10,132 | 92.5% |
| Methodist Rehabilitation Hospital | Dallas | 50 | 1,318 | 15,628 | 85.6% |
| Combined | — | 253 | 5,103 | 77,733 | 84.2% |
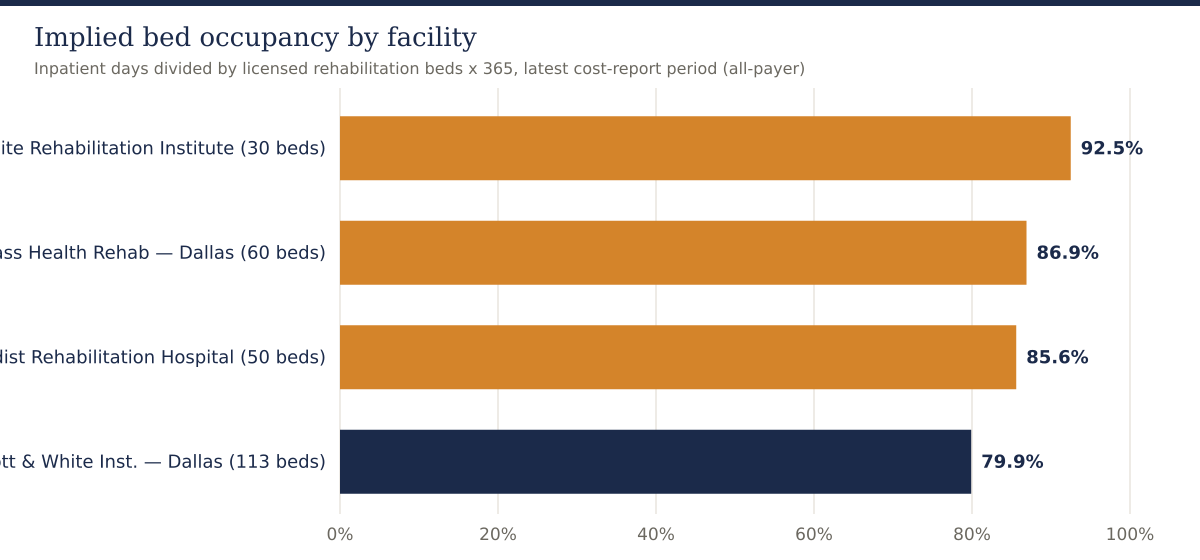
Occupancy in the mid-80s and above is high for inpatient rehabilitation. After allowing for admission processing, discharge timing, gender and acuity matching, and infection-control holds, facilities running near 90% are effectively full on many days. Mesquite Rehabilitation Institute’s 92.5% implied occupancy on only 30 beds is the clearest capacity signal in the dataset.
Average length of stay also differs meaningfully: Medicare fee-for-service stays range from about 11.4 days at Methodist Rehabilitation Hospital to about 14.8 days at Mesquite, with Baylor Scott & White at 14.3 days — consistent with its higher case-mix index of 1.3253, the highest acuity in the market.
The same analysis is available for any market — hospital and ASC market reports by county or service area cover facility inventory, capacity, utilization, financial performance and competing development.
Latest-period financial results vary widely across the four facilities:
| Facility | Period end | Net patient revenue | Operating income | Operating margin | Net income |
|---|---|---|---|---|---|
| Baylor Scott & White Institute for Rehabilitation – Dallas | 6/30/2025 | $195.8M | –$4.3M | –2.2% | $37.2M |
| Encompass Health Rehabilitation Hospital of Dallas | 6/30/2025 | $32.8M | $1.0M | 3.1% | $3.0M |
| Mesquite Rehabilitation Institute | 12/31/2024 | $18.0M | $3.8M | 21.0% | $3.7M |
| Methodist Rehabilitation Hospital | 12/31/2024 | $33.7M | $9.8M | 29.1% | $9.9M |
| Combined | — | $280.3M | $10.3M | 3.7% | $53.8M |
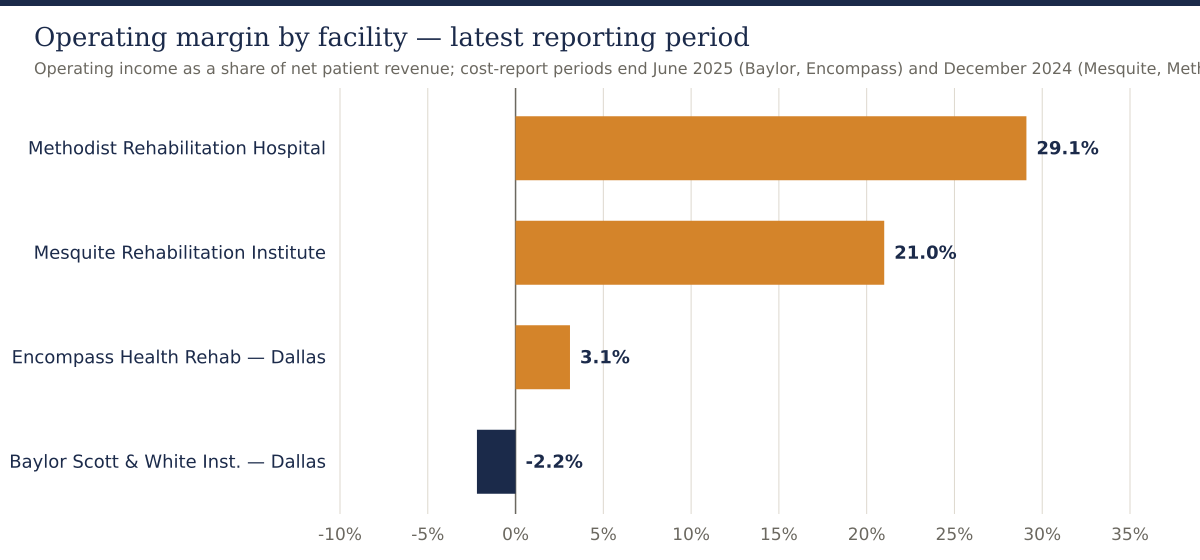
Two results stand out. Methodist Rehabilitation Hospital’s 29.1% operating margin and Mesquite’s 21.0% margin demonstrate that a focused, well-run rehabilitation hospital in this market can be highly profitable — consistent with MedPAC’s national finding that freestanding IRFs outperform hospital-based units. Mesquite has also grown net patient revenue at roughly a 10% compound annual rate since 2020.
Baylor Scott & White’s result requires careful interpretation. Its cost-report entity is far larger than a single rehabilitation hospital — net patient revenue of $195.8 million includes an extensive outpatient therapy network — and its –2.2% operating margin is offset by roughly $40.6 million of non-operating and system support, producing $37.2 million of net income. Its economics are those of a system flagship, not a standalone benchmark. Encompass Health’s Dallas hospital returned to a positive 3.1% operating margin in fiscal 2025 after three years of modest operating losses, even while running near 87% occupancy — a reminder that high utilization does not automatically produce high margins if payer mix and cost structure are unfavorable.
Across the four facilities, traditional Medicare fee-for-service discharges declined about 4% from federal fiscal 2021 to 2025, while Medicare Advantage discharges grew about 29% — from 785 to 1,014. Medicare Advantage now represents roughly 28.5% of combined Medicare volume, up from 22.9% in fiscal 2021.
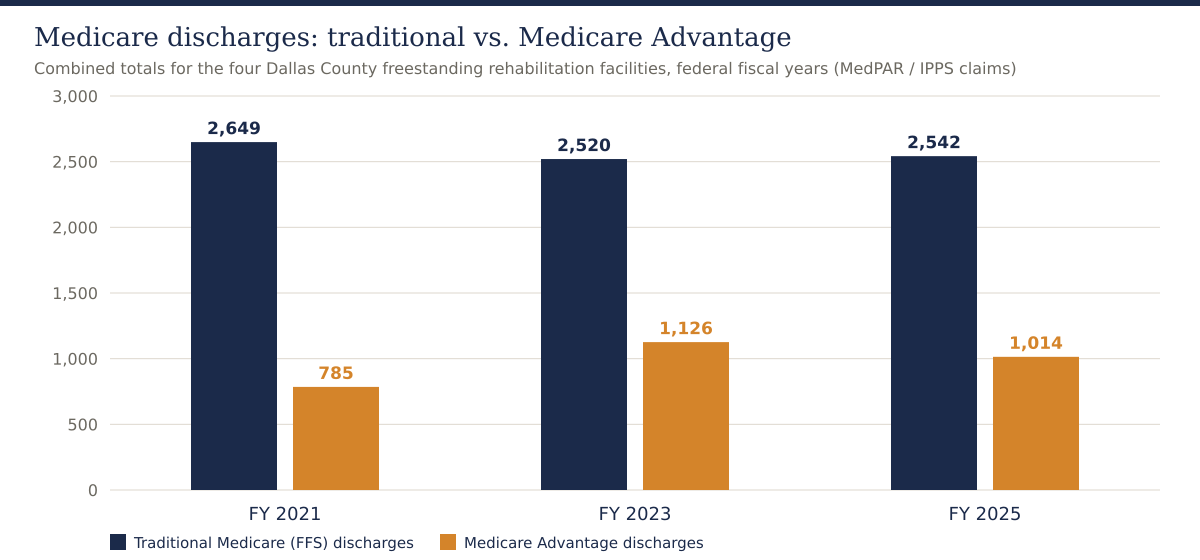
The facility-level pattern is more dramatic. Methodist Rehabilitation Hospital’s traditional Medicare discharges fell about 29% over four years — from 652 to 460 — while its Medicare Advantage volume grew about 44%, from 244 to 351. Encompass, by contrast, grew traditional Medicare volume about 13% while its Medicare Advantage volume slipped about 9%. Mesquite’s Medicare Advantage volume rose about 60% from a small base.
Medicare fee-for-service payment and acuity indicators for fiscal 2025 underline how differently the four facilities are positioned:
| Facility | Case-mix index | Medicare payment per case | Medicare ALOS (days) | FFS discharges FY21 → FY25 | MA discharges FY21 → FY25 |
|---|---|---|---|---|---|
| Baylor Scott & White – Dallas | 1.3253 | $28,206 | 14.3 | 703 → 640 | 215 → 307 |
| Encompass Health – Dallas | 1.2028 | $24,084 | 12.1 | 893 → 1,007 | 240 → 218 |
| Mesquite Rehabilitation Institute | 1.2627 | $29,020 | 14.8 | 401 → 435 | 86 → 138 |
| Methodist Rehabilitation Hospital | 1.2504 | $25,844 | 11.4 | 652 → 460 | 244 → 351 |
Why it matters for feasibility: Medicare Advantage plans typically reimburse rehabilitation stays below traditional Medicare, apply prior-authorization and concurrent review, and steer some candidates to skilled nursing or home health instead. A pro forma built on traditional Medicare rates applied to all Medicare volume will overstate revenue. Any Dallas County project should model Medicare Advantage penetration continuing to rise, with plan-specific contracted rates and denial-rate assumptions.
Across all four facilities, the highest-volume Medicare case categories are musculoskeletal aftercare, nervous-system disorders including stroke, and degenerative neurological conditions. Encompass’s neurology-heavy mix — roughly 40% of its Medicare discharges — reflects the classic freestanding-IRF program built around the CMS-13 qualifying conditions. Baylor Scott & White’s higher case-mix index indicates it treats the market’s most complex patients, consistent with its role in brain-injury and spinal-cord rehabilitation.
For a new entrant or expansion, program mix is a compliance requirement as much as a clinical choice: the 60% rule effectively requires a referral base rich in stroke, neurological, brain-injury, and hip-fracture cases. A project premised primarily on elective joint-replacement rehabilitation — a shrinking inpatient category as joint replacement migrates outpatient — would face both compliance and demand headwinds.
ZIP-code patient-origin data shows the four facilities serve largely distinct geographic territories rather than competing head-to-head:
Individual facility market shares within even their strongest ZIP codes are modest — generally 2% to 6% of rehabilitation-eligible discharges — confirming that most rehabilitation candidates are treated in hospital-based units, skilled nursing facilities, or facilities outside the county. Notably, no freestanding facility in the dataset anchors the western and northwestern parts of the county — the Irving, Grand Prairie, and Farmers Branch corridor — which together hold several hundred thousand residents.
Recent-year origin trends also diverge: Encompass grew total origin-area discharges about 11% year over year, while Baylor Scott & White and Methodist each declined about 20% — shifts that should be investigated through referral-source interviews before relying on any facility’s historical volume as a market baseline.
This is likely the lowest-risk opportunity. Mesquite Rehabilitation Institute at 92.5% implied occupancy on 30 beds, and Encompass at 86.9% on 60 beds, are operating near practical limits. An expansion backed by documented referral backlog, payer contracts already in place, and an existing staffing platform carries far less risk than any greenfield project. The threshold question is whether admissions are actually being declined or delayed for capacity reasons — daily census patterns, referral-conversion rates, and denied-admission logs must be verified.
The Irving–Grand Prairie–Farmers Branch corridor appears in no facility’s core patient-origin territory. A 30-to-40-bed facility positioned near the corridor’s acute-care hospitals could serve a population currently traveling east or into Tarrant County. This is the most attractive greenfield thesis in the dataset — but it must first be tested against hospital-based rehabilitation units in the corridor, which the dataset does not capture, and against the referral intentions of the hospitals that would feed it.
Stroke-certified programs, brain-injury programs, and other niche certifications strengthen both referral flow and 60%-rule compliance. Baylor Scott & White holds the high-acuity position; a focused competitor could differentiate on dedicated stroke recovery, neuro-oncology rehabilitation, or ventilator weaning rather than competing on breadth.
Nationally, health systems increasingly partner with rehabilitation operators to convert hospital-based units into freestanding joint-venture facilities — the model behind many Encompass and Kindred projects. Dallas–Fort Worth systems operating rehabilitation units inside acute hospitals are natural candidates. For the system, a joint venture monetizes an underperforming unit and frees acute beds; for the operator, it secures the referral base that determines rehabilitation feasibility.
With Medicare Advantage nearing 30% of Medicare volume and still climbing, network position is becoming a competitive moat. A facility with strong MA contracts and efficient prior-authorization operations can capture volume competitors lose to denials. Conversely, a new facility without MA network access would start with a structural handicap in nearly a third of the Medicare market.
| Strategy | Relative risk | Best suited for |
|---|---|---|
| Bed expansion at an existing facility | Lower | Documented census pressure and referral backlog |
| Hospital–operator joint venture | Moderate | Systems with hospital-based units to convert |
| Facility acquisition | Moderate | Operators seeking immediate market entry |
| Specialty-differentiated greenfield | Moderate to high | Committed referral sources and niche clinical programs |
| Undifferentiated greenfield IRF | High | Only where a verified geographic gap exists |
| Indicator | Assessment | Interpretation |
|---|---|---|
| Demographic demand | Strong | Large, growing county with an aging population |
| Freestanding capacity utilization | High | 84.2% combined occupancy; two facilities above 85% |
| Facility financial health | Mixed | Margins range from –2.2% to 29.1% |
| Traditional Medicare volume | Flat to declining | –4% across four fiscal years |
| Medicare Advantage exposure | Rising rapidly | +29% discharge growth; ≈28.5% of Medicare volume |
| Regulatory barrier to entry | Low | No Texas certificate-of-need requirement |
| Bed-expansion opportunity | Attractive | Capacity-constrained facilities with referral demand |
| Western-county geographic gap | Potential | Must be validated against hospital-based units |
| Greenfield multispecialty entry | Cautious | Requires committed referral sources and MA network access |
The dataset establishes freestanding-facility financial performance and Medicare utilization, but several decisive facts are not visible in public reporting. Before a lender or investor relies on a Dallas County rehabilitation thesis, the analysis should obtain:
A market with high occupancy can still be unsuitable for a particular project, site, bed count, or capital structure. A Wert-Berater rehabilitation facility feasibility study converts the preliminary market indicators into a lender- and investor-usable decision framework.
For an operator or developer, the study determines whether the opportunity should be pursued as a new facility, bed expansion, acquisition, hospital joint venture, or no-build strategy. For a lender, it establishes whether projected cash flow can support the proposed capital structure under base and downside conditions — including a downside where Medicare Advantage penetration accelerates. For a health system, it evaluates whether converting a hospital-based unit to a freestanding joint venture creates incremental value. For investors, it tests demand, competitive capacity, and absorption before capital is committed.
A complete analysis would typically include primary and secondary service-area definition, drive-time and patient-origin analysis, a full competitor inventory including hospital-based units and skilled nursing alternatives, referral-source validation, program and case-mix design against the 60% rule, payer and reimbursement analysis including Medicare Advantage contracting, staffing and physiatrist coverage models, the development and equipment budget, a ten-year operating pro forma, ramp-up and working-capital analysis, break-even occupancy, debt-service coverage and lender ratios, base and downside cases, and an independent feasibility conclusion. Our broader healthcare feasibility studies and hospital feasibility studies apply the same lender-grade discipline across facility types.
And if you are evaluating a different geography, Wert-Berater prepares this same analysis for any county or state in the United States: custom hospital and healthcare facility market reports start at $1,950 and are delivered in 3–5 business days.
Dallas County’s freestanding inpatient rehabilitation market combines strong demographics, high utilization, and demonstrated profitability at well-run facilities. It is also financially uneven, structurally exposed to the Medicare Advantage shift, and incompletely described by freestanding data alone.
The evidence favors bed expansion at capacity-constrained facilities, a validated western or northwestern county project, specialty program differentiation, hospital joint-venture conversions, and deliberate Medicare Advantage network strategy. It does not support a general conclusion that any new rehabilitation facility anywhere in Dallas County will succeed — referral commitments and payer contracting will separate feasible projects from stranded capital.
Wert-Berater prepares independent inpatient rehabilitation and therapy facility feasibility studies for operators, health systems, developers, investors, and lenders. The analysis can evaluate market demand and competitive capacity, referral-source volume, payer mix and Medicare Advantage reimbursement, geographic service gaps, bed count and program requirements, development and equipment costs, staffing assumptions, break-even occupancy, debt-service capacity, and base and downside financial scenarios.
Contact Wert-Berater to evaluate a proposed Dallas County rehabilitation facility, expansion, acquisition, or hospital joint venture — or schedule a qualification Zoom to discuss scope.
The four freestanding facilities in the July 2026 dataset operate 253 beds at an implied 84.2% combined occupancy, with two facilities above 85%. That signals tight freestanding capacity, but the dataset excludes rehabilitation units inside acute-care hospitals and skilled nursing alternatives, so a definitive supply conclusion requires a full inventory and patient-origin analysis.
Bed expansion at high-occupancy facilities, a western or northwestern county project near Irving and Grand Prairie where no freestanding facility appears in the dataset, specialty program differentiation such as stroke or brain-injury certification, and hospital joint-venture conversions all appear more supportable than an undifferentiated greenfield facility next to existing competitors.
Across the four facilities, Medicare Advantage discharges grew about 29% from federal fiscal 2021 to 2025 while traditional Medicare discharges declined about 4%. Medicare Advantage now represents roughly 28.5% of combined Medicare volume. MA plans typically pay less than traditional Medicare and apply prior authorization, so payer contracting is now a first-order feasibility question.
Lenders should evaluate referral-source commitments from acute-care hospitals, projected case mix and CMS-13 compliant diagnosis mix, payer mix including Medicare Advantage contracted rates, physiatrist and therapy staffing plans, nursing labor costs, development and equipment budgets, ramp-up absorption, break-even occupancy, debt-service coverage, and downside scenarios.
A feasibility study tests whether the proposed market, site, bed count, program mix, referral base, staffing model, reimbursement assumptions, and capital structure can support a sustainable operation, and compares greenfield development with expansion, acquisition, or joint-venture alternatives before capital is committed.
Disclaimer: This article is provided for general informational and marketing purposes. It does not constitute legal, accounting, financial, investment, or lending advice, and it is not a feasibility study or an appraisal. Facility financial figures are drawn from Medicare cost reports and utilization data compiled in July 2026; reporting periods vary from calendar 2024 through fiscal years ending June 2025, and cost-report entities may include operations beyond a single hospital. The dataset covers freestanding rehabilitation facilities only. Market conditions, reimbursement policy, and regulatory requirements change. Readers should confirm current requirements with their lender, counsel, and professional advisers before making development or investment decisions.

President, Wert-Berater, Inc. — independent feasibility study consultants since 1998. 4,000+ engagements completed across all 50 states and internationally, evaluating $43.8 billion in project value for SBA, USDA, EB-5, conventional, and institutional financing decisions — including healthcare, medical facility, and lender-reviewed engagements. Fiduciary duty runs to the lender and agency in every engagement.
+1 310-857-2443 ext. 800 · email · 1968 South Coast Hwy, Ste 2382, Laguna Beach, CA 92651 · 111 Town Square Pl Ste 1238 PMB 657834, Jersey City, NJ 07310 · 539 W. Commerce St #8486, Dallas, TX 75208 · 66 W Flagler Street, Suite 900, PMB 12704, Miami, FL 33130
Schedule a ConversationSpeak with Wert-Berater about a proposed Dallas County rehabilitation facility, bed expansion, acquisition, or hospital joint venture. Provide the project location, proposed bed count and programs, referral relationships, and lender requirements to receive a project-specific scope. Independent feasibility studies since 1998: 4,000+ engagements, $43.8 billion in evaluated project value.
Legal disclosure. Wert-Berater, Inc. offices are mailing addresses only. Following the COVID-19 pandemic the firm has elected to work remotely; its office locations receive mail and are not staffed for visitors or in-person meetings. Headquarters mailing address: 1968 South Coast Hwy, Ste 2382, Laguna Beach, CA 92651.
Wert-Berater, Inc. is an independent provider of feasibility studies and other related services. The firm does not provide financing or equity investment advice, and does not arrange, broker, or place debt or equity capital of any kind.
All appraisal assignments are performed by Bruce E. Jones, MAI, ASA-GC, BCA, CMEA, a member of the Appraisal Institute since 2006, a staff member of Wert-Berater, Inc. and owner of Special Purpose Realty Valuation.
Thousands of real estate, business, and machinery appraisal and litigation assignments.