
The feasibility study answers whether a project should be financed. Monitoring answers the question that follows for the life of the asset: is it performing the way the analysis said it would — and if not, why, and what does that mean for coverage?
Every Wert-Berater study ships with a fully linked financial model — zero hardcoded numbers, every assumption traceable to a cited source. Monitoring puts that instrument to its second use. Each quarter, the firm refreshes the model with the asset’s actual results and re-runs the full analytical battery against them: budget-versus-actual variance line by line, debt service coverage against the lender’s thresholds, covenant compliance, the complete ratio set with written interpretation, Altman Z-Score trajectory, and a re-check of the market evidence — the same published sources the original study was built on, updated to the current vintage. The deliverable is a quarterly performance memorandum, principal-reviewed and signed, with the refreshed model behind it.
Independent quarterly verification of how operating assets are actually performing against underwriting — from an analyst with no stake in the answer. Portfolio-level rollups across multiple assets.
Post-closing surveillance for special-purpose credits: coverage tracking, covenant testing, and early-warning variance flags — against the same model the committee approved.
Institutional asset-management discipline without the institution: where performance is drifting from plan, which assumptions are proving wrong, and what the trajectory means before the lender asks.
Through the firm’s secure client portal: a project hub holding the quarterly memoranda, refreshed linked models, and the running variance record, with email delivery each quarter.
The analytical engine is the same — the linked model refreshed against actuals every quarter — but the program is calibrated to who is reading it. A lender protects a fixed repayment; equity and developers protect a return. Those are different questions, and the memorandum answers the one you are asking.
For lenders and Certified Development Companies, monitoring runs as credit surveillance: is the underwriting basis still valid, and will the debt be serviced? For 504 credits specifically, the firm operates a dedicated program built around CDC servicing responsibilities — see SBA 504 Portfolio Monitoring for CDCs. For family offices, funds, and sponsor-developers, the same discipline is pointed at the equity story instead: the return, the promote, the exit, and the decisions the owner still controls.
| Lender & CDC program | Equity & developer program | |
|---|---|---|
| The core question | Will the debt be serviced, and does the collateral still support the exposure? Downside-focused by design. | Is the thesis holding — will the asset deliver the underwritten return, and what should the owner do about it if not? |
| Headline metrics | DSCR against loan thresholds, covenant compliance, collateral condition and liens, risk-rating direction, exceptions. | Project & equity IRR re-solved against actuals, equity multiple, stabilized NOI and value, distributions, waterfall position, hold-vs-sell math. |
| Construction phase | Funding adequacy: cost-to-complete, remaining contingency, equity contributed — will capital remain to open the business? | Return erosion: what each month of delay and each dollar of overrun does to the developer’s IRR, the promote, and the refinance window. |
| Variance lens | Departures from the approved credit basis, documented for servicing files and future SBA or regulator review. | Which underwriting assumptions are proving wrong, what the trajectory implies, and the decisions still open — refinance, hold, reposition, sell. |
| Who reads it | Credit administration, servicing staff, watchlist committees, the CDC board. | Principals, LPs, investment committees — an independent report that stands in for the sponsor-authored deck investors discount. |
| Reporting posture | Exception-driven: risk assessment, watch items, matters requiring management attention. | Performance-driven: the full KPI dashboard and trend record, exportable to PDF, PowerPoint and Excel for the next investor meeting. |
Both programs run on the same portal, the same cadence, and the same fixed-retainer terms — and where a project has both a lender and an equity group, each side can hold its own engagement with its own scope, independence intact.
The quarterly update your investors receive is usually written by the sponsor — the party whose performance is being judged. Independent monitoring adds the layer institutional capital expects: a report authored by an analyst with no stake in the answer, reconciled to the underwriting the deal was approved on.
Whether you answer to limited partners, an investment committee, a credit committee, or your own family-office principals, the monitoring memorandum gives you something a self-authored update cannot: verification. Each quarter reconciles the asset’s actual results back to the model the capital was committed against, so the people who wrote the checks can see — in the same framework every period — whether the thesis is holding.
The analysis comes from a third party with no economic interest in the outcome, principal-reviewed and signed. That independence is precisely what LPs, lenders and boards discount a sponsor-authored deck for.
Every period is scored against the original feasibility model — budget-versus-actual, DSCR against the lender’s thresholds, covenant compliance — so “how are we doing?” has a documented, apples-to-apples answer.
Coverage slippage, lease-up lag and cost creep surface as flagged variances with a written rationale — while there is still time to act, and before the lender or an LP raises it first.
The same structure and the same metrics every period build a running record investors can trend, rather than a fresh, differently-shaped narrative each cycle.
Most asset updates arrive as a slide deck: a snapshot, frozen on the day it was made, showing only the conclusion its author chose to show. Monitoring is delivered as a living report you and your investors log into — refreshed every quarter, drillable to the source, and exportable on demand.
| A static pitch deck | The Wert-Berater monitoring platform | |
|---|---|---|
| The numbers | Frozen on the day the deck was built; stale the moment the quarter turns. | Re-run every quarter against actuals — the linked model refreshes and the whole report follows. |
| Depth | A summary; you see the headline and take the author’s word for it. | Drill from a headline KPI down to the line item, the assumption, and the cited source behind it. |
| Who authored it | The sponsor raising or holding the capital. | An independent analyst with no stake in the outcome — principal-reviewed and signed. |
| Cadence | One-time, at the raise or the annual meeting. | Every quarter, in the same structure, so periods are directly comparable. |
| Access | A PDF emailed around and forwarded on. | A secure portal, always current, with audited downloads — per authorized viewer. |
| Risk | A paragraph of narrative, if any. | Nine risk categories individually scored 1–5, quarter-over-quarter, with named watch items. |
| History | The newest deck supersedes and buries the last. | Every period retained; the full variance record is one click away. |
| Take-aways | Screenshot it, or retype the figures into your own model. | One-click export to PDF, a branded PowerPoint deck, and the underlying Excel model. |
Each monitoring period is delivered as a complete, interactive report in your portal — the same seventeen sections the sample below walks through. Every edition contains:
Illustrative sample · hypothetical data
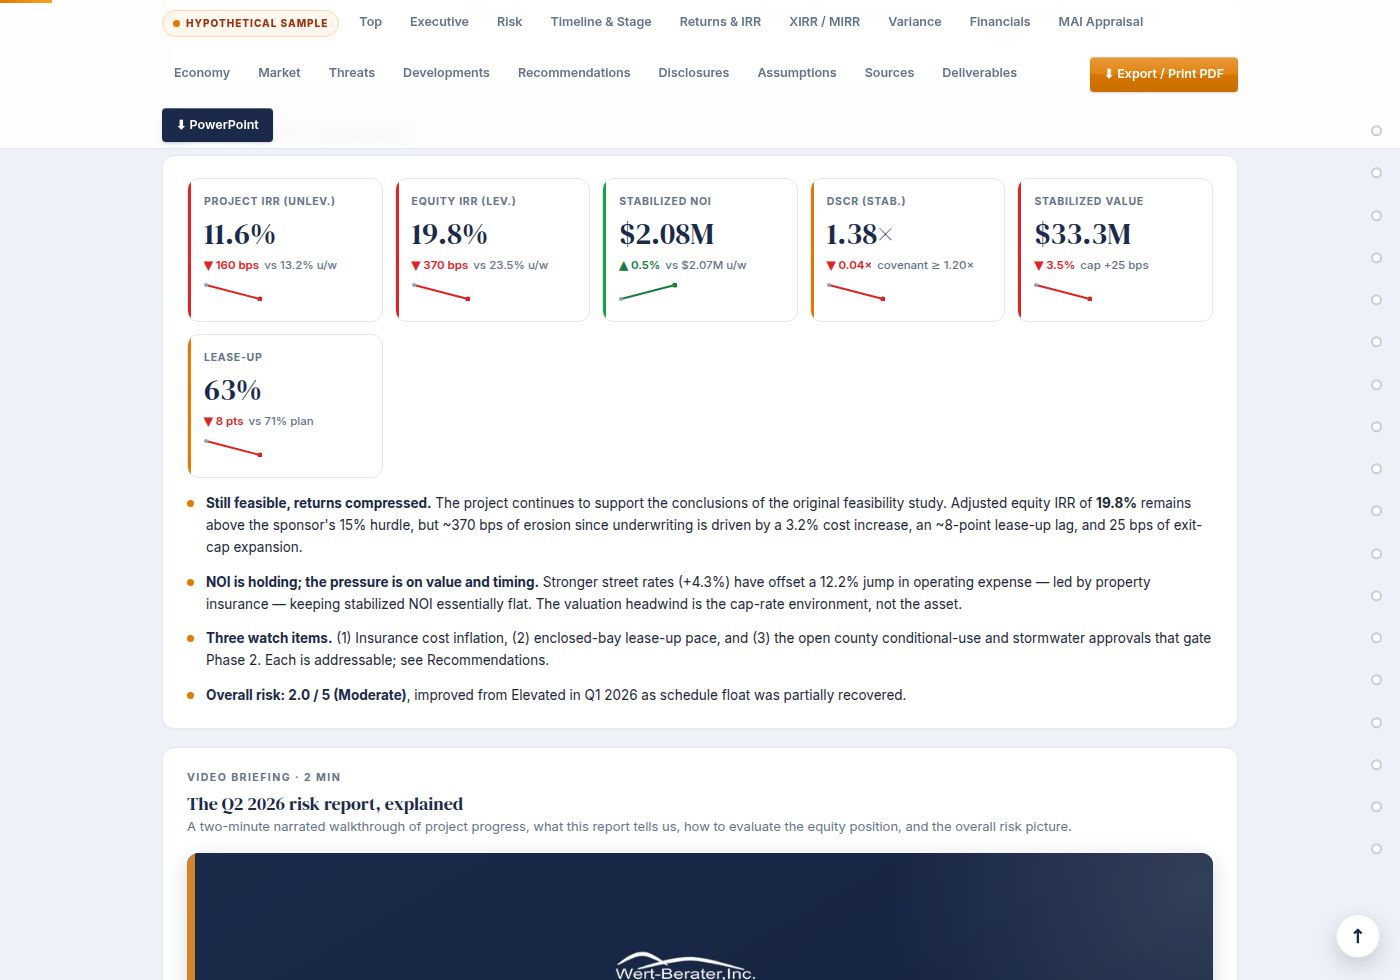
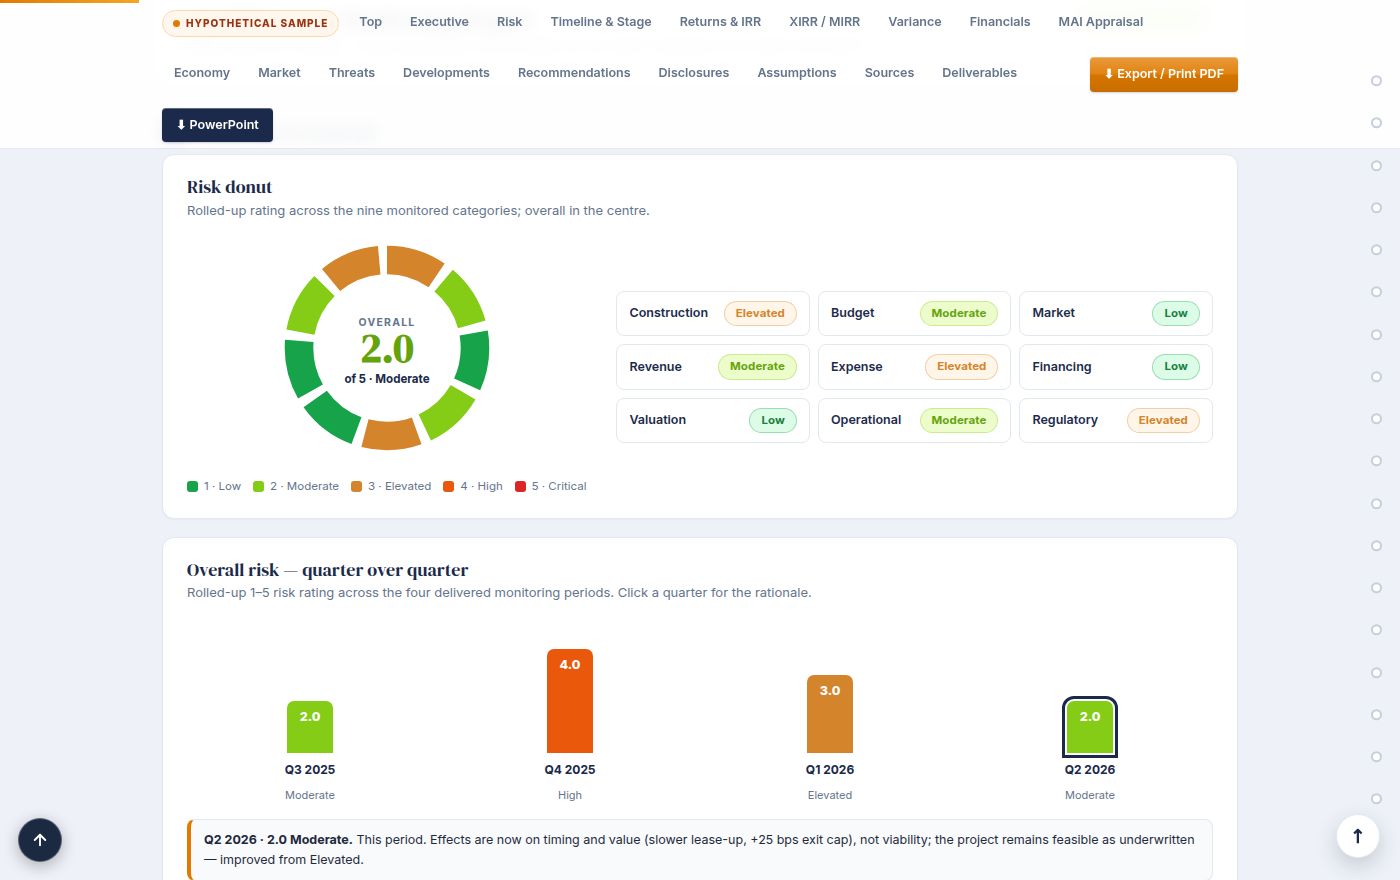
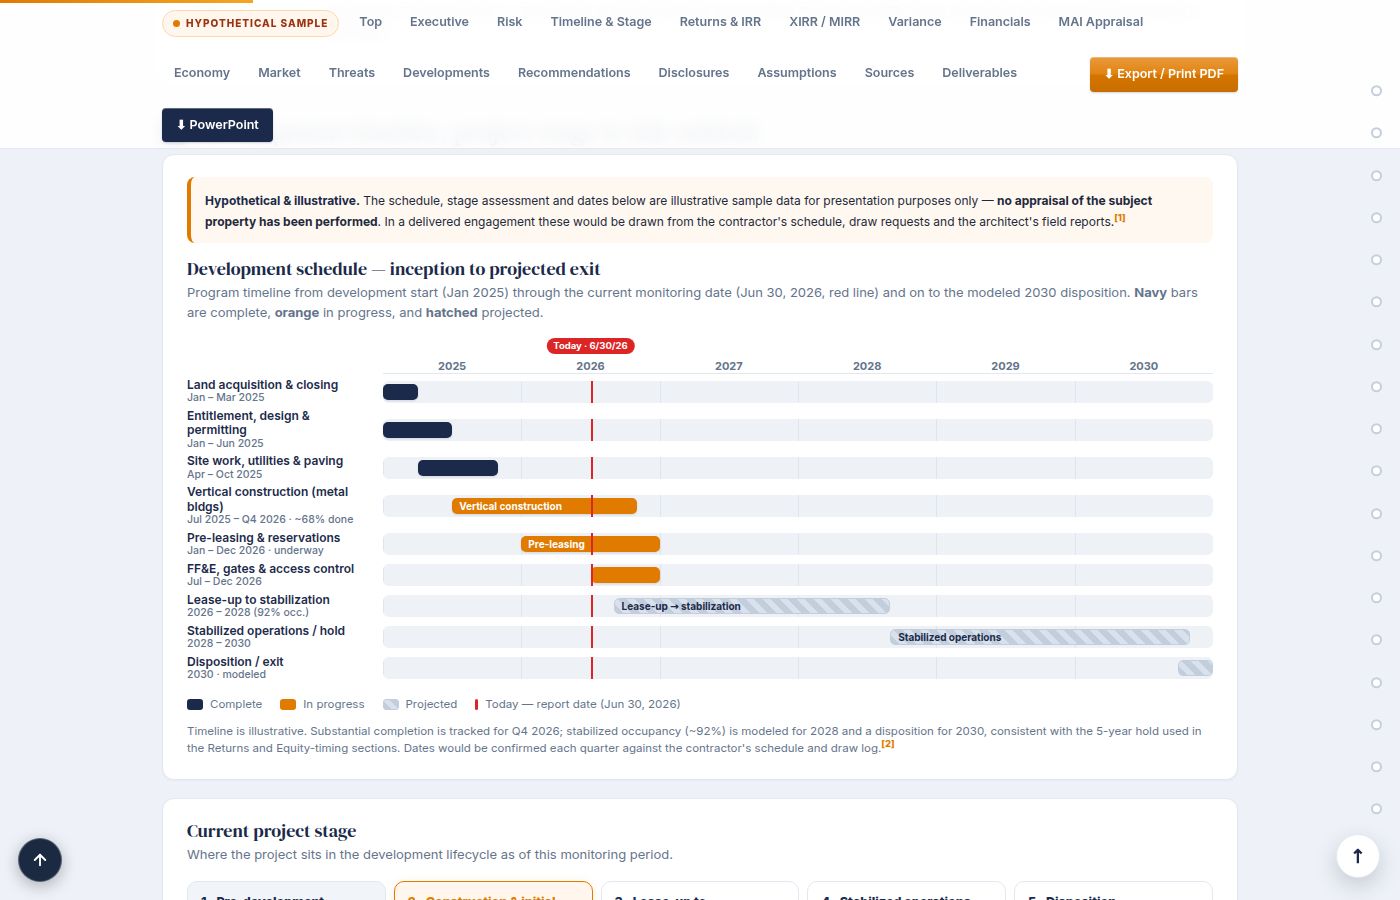
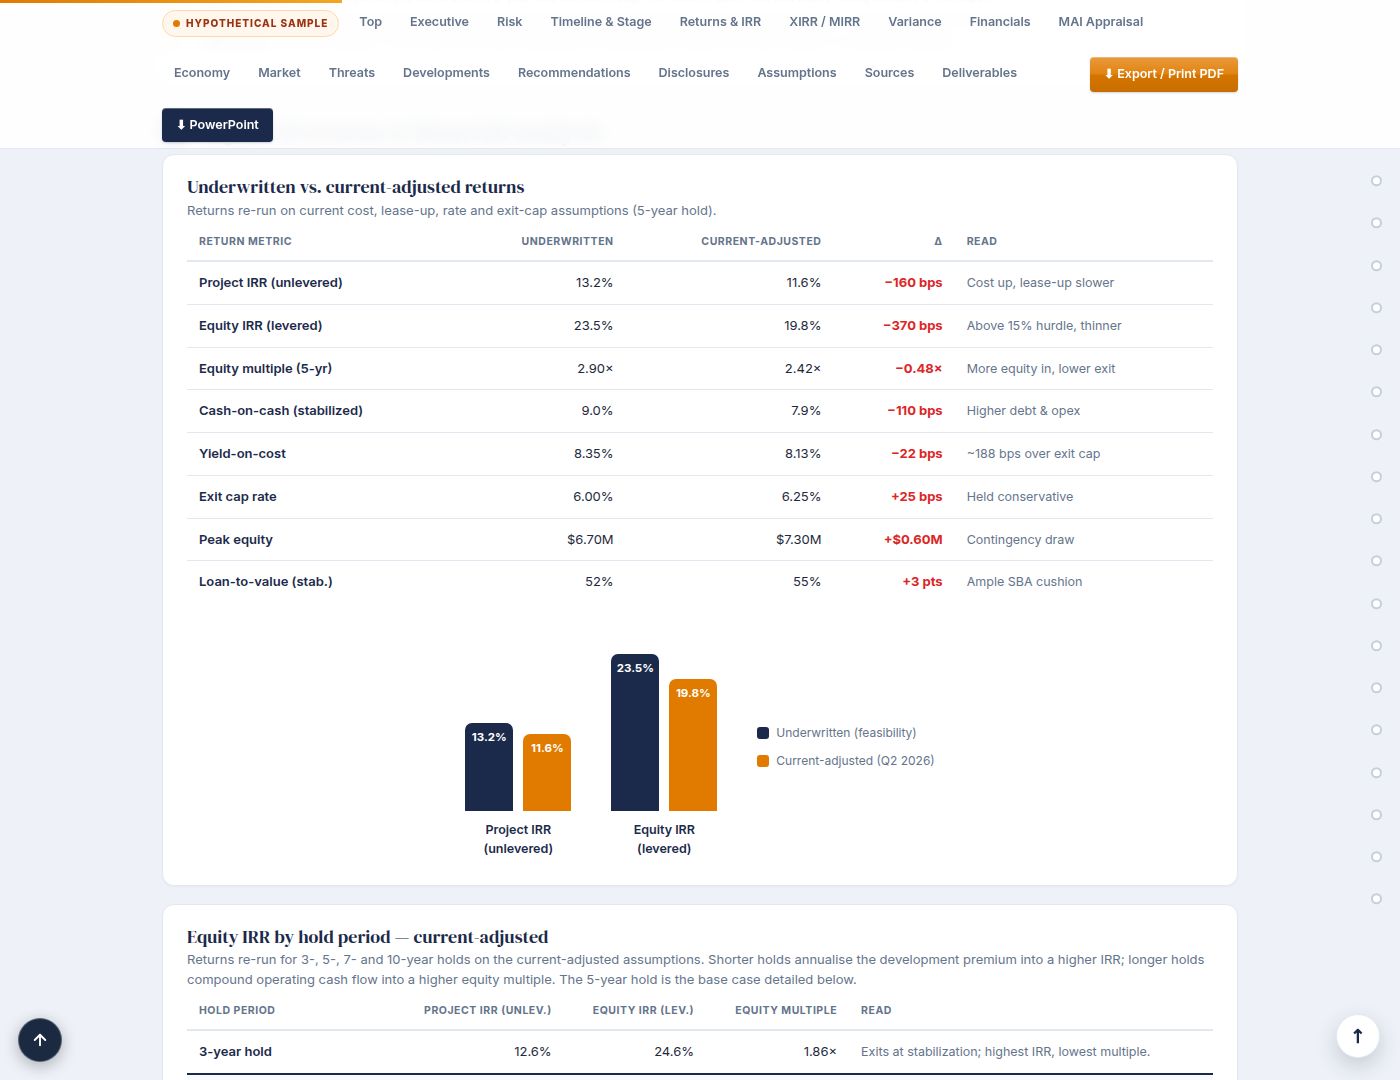
Below are actual screens from a monitoring report. This is an illustrative sample built on hypothetical data — no appraisal of any property has been performed — shown only to demonstrate how the platform presents a quarter. Open the full interactive sample report →
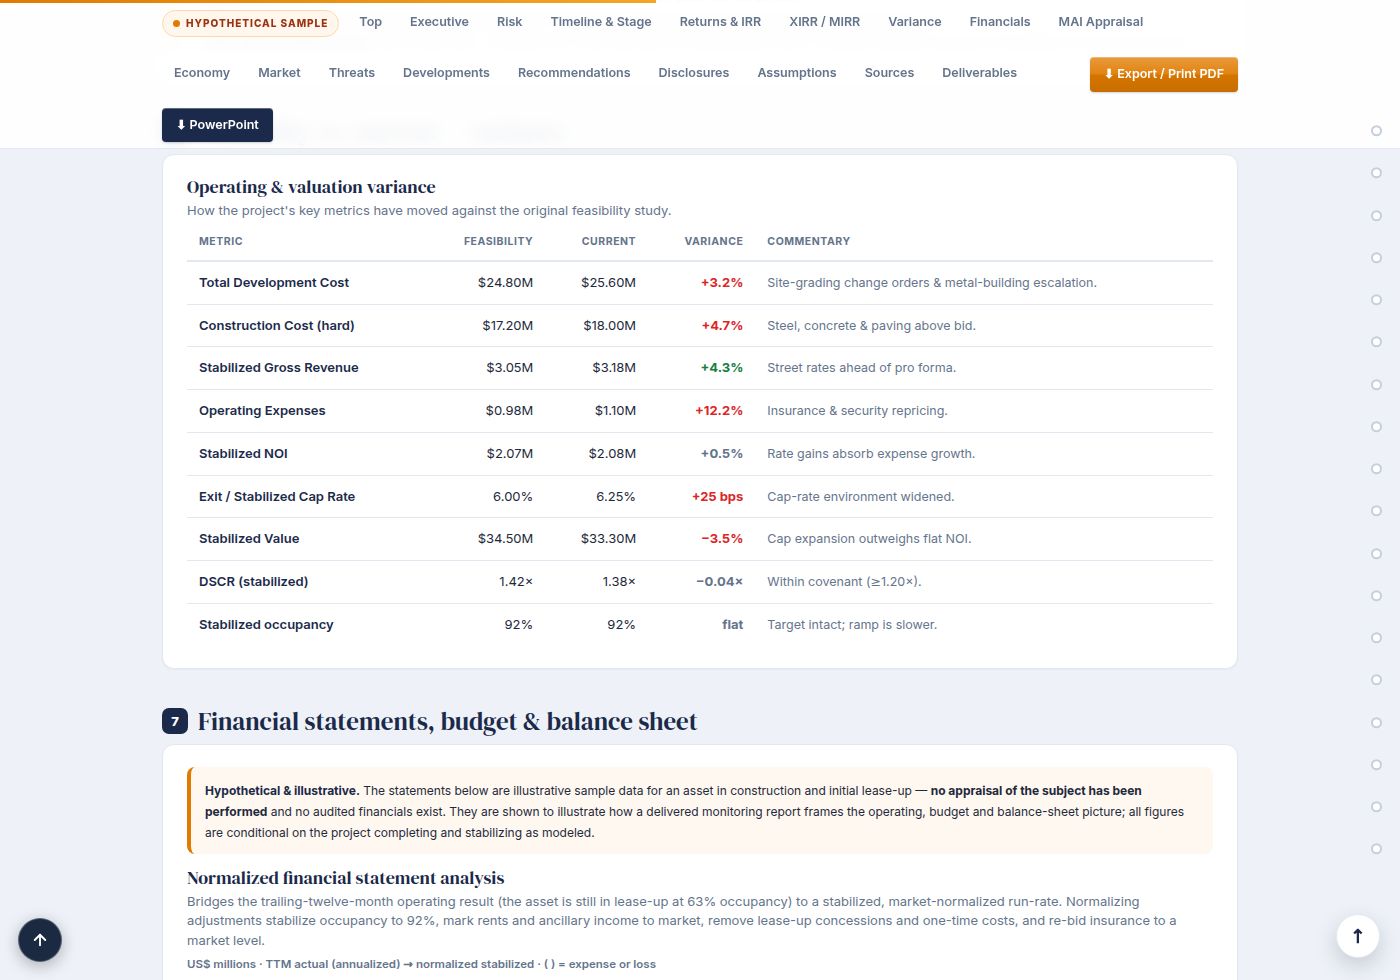
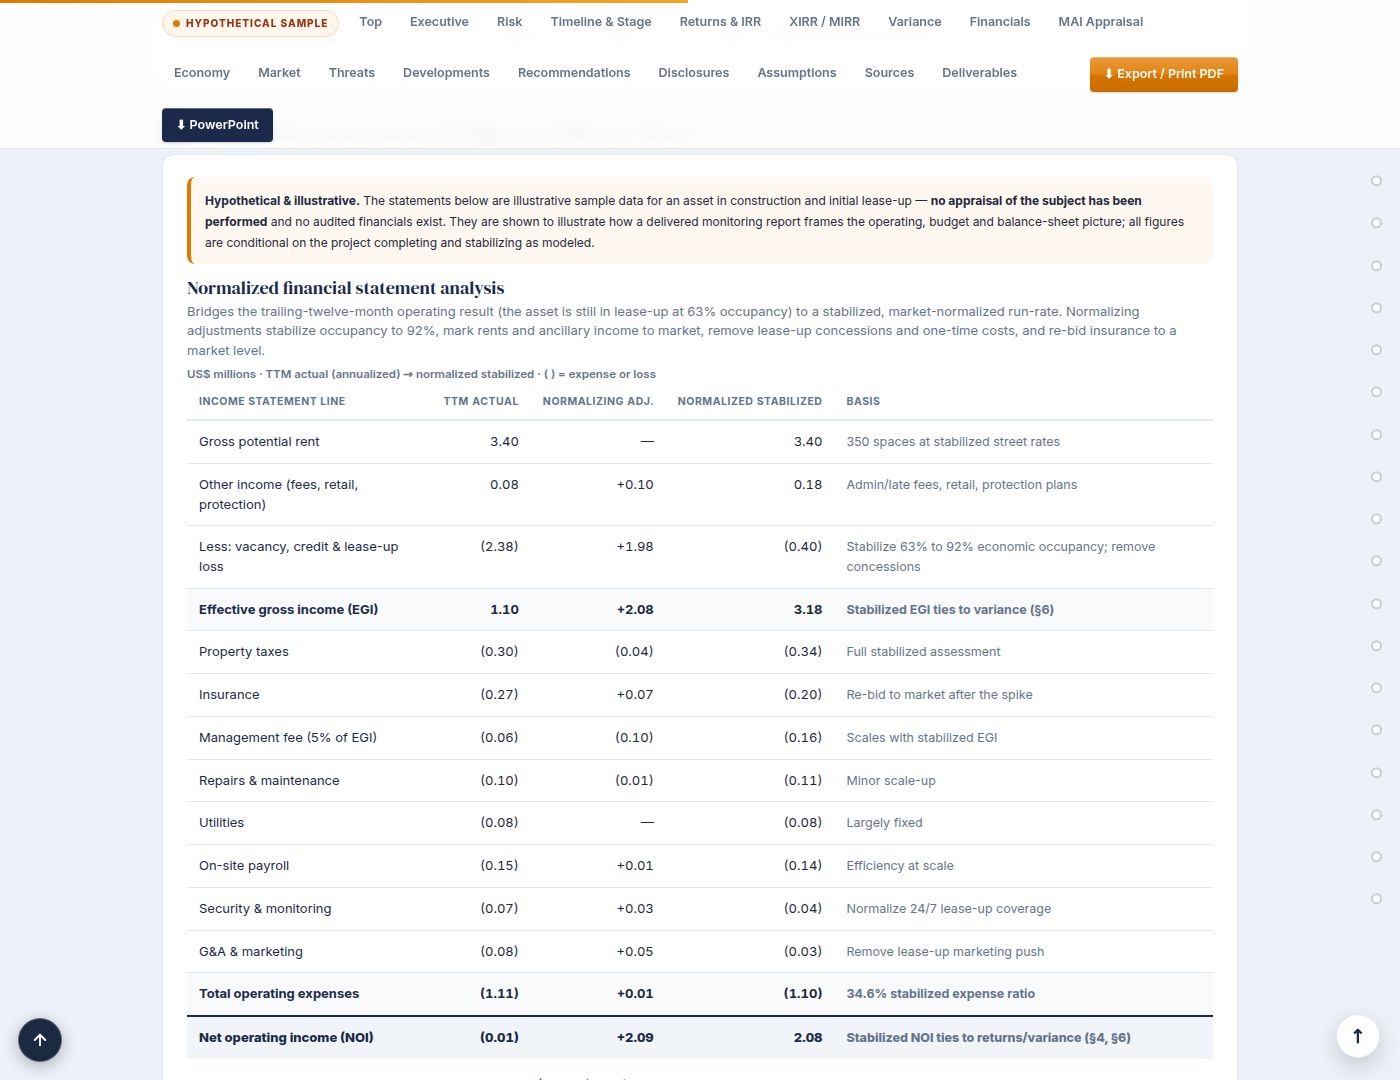
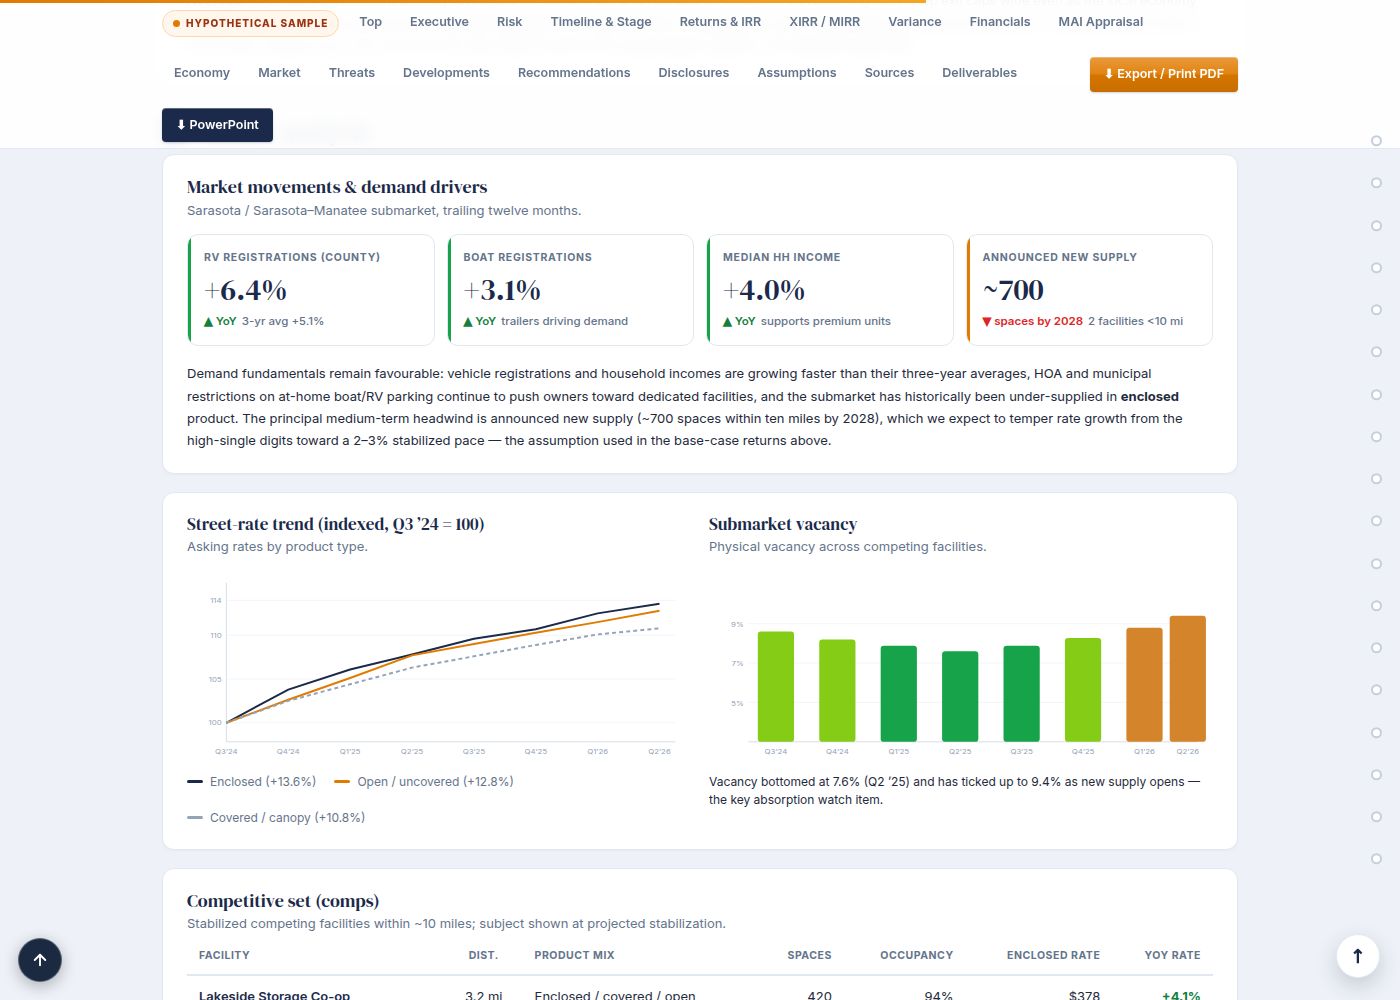
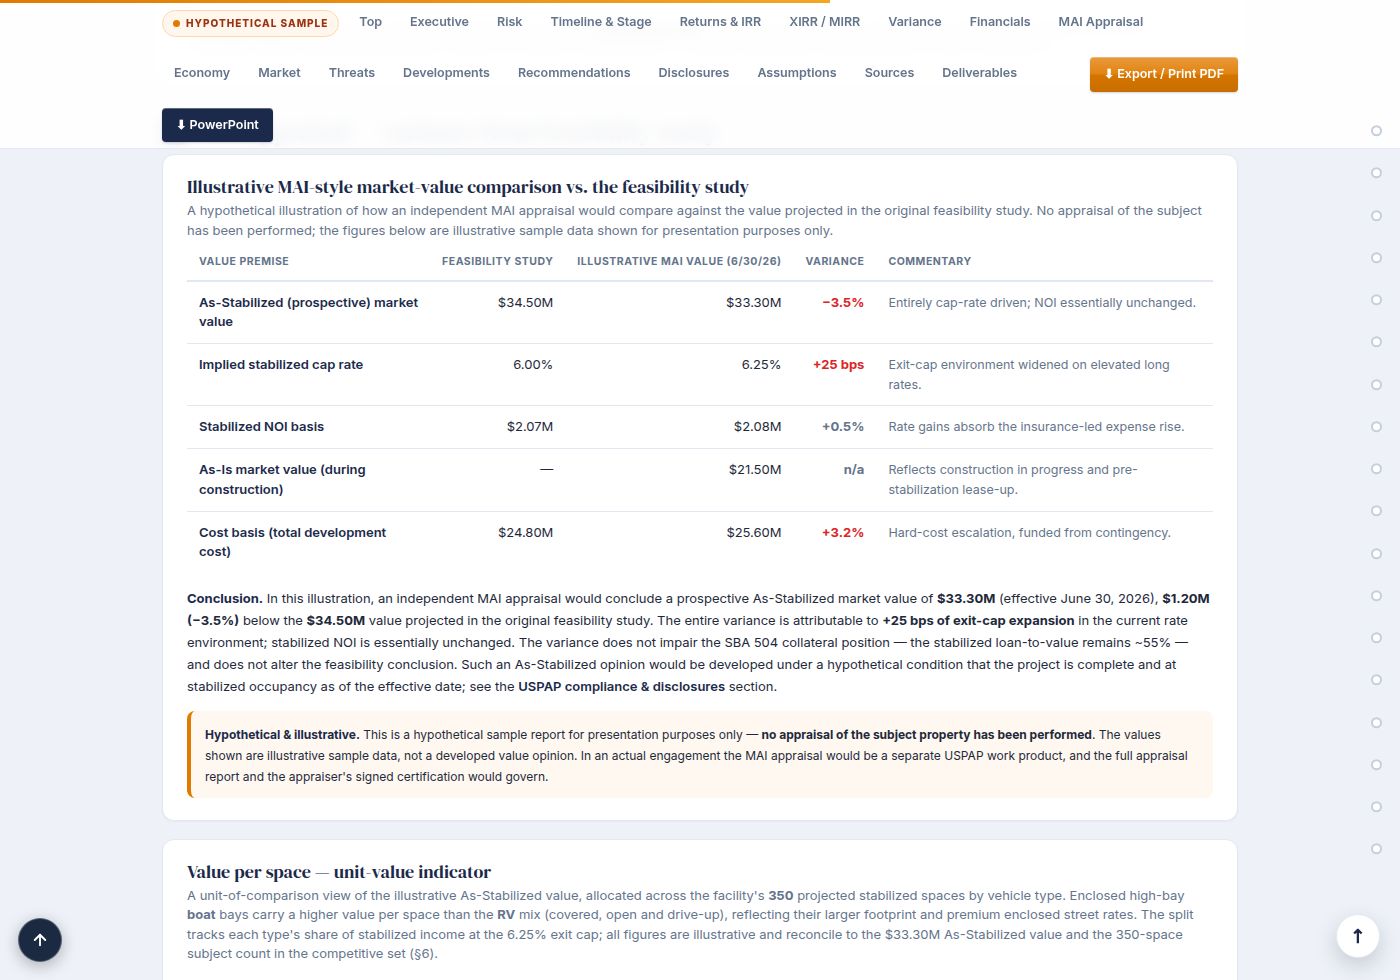
Fixed quarterly retainers per asset, quoted in advance and never contingent on the findings. Multi-asset portfolios are quoted as a portfolio. Available for assets the firm originally studied and, after an onboarding model rebuild, for assets it did not.
A quarterly monitoring engagement is not a repackaged underwriting study. It is a structured, recurring reconciliation of actual operating results against the assumptions that supported the original credit decision. For a portfolio of income-producing assets — whether stabilized commercial real estate, operating businesses, renewable-energy projects or a mixed book — each reporting cycle produces a discrete, auditable record of where performance stands relative to the underwritten base case.
The deliverable is a live, drillable report refreshed each quarter across seventeen sections. Concrete components specific to this engagement type include:
Every underlying model remains a fully linked Excel workbook with no hardcoded values, so a credit officer or agency reviewer can stress any single input and observe the effect on coverage without requesting a new engagement.
Demand analysis in a quarterly monitoring context differs from the static market study prepared at origination. The question is no longer whether demand exists; it is whether the conditions that justified the original demand forecast still hold, and whether competitive supply has changed in ways that affect stabilized occupancy, lease rates, contract pricing or throughput assumptions.
For real-estate-heavy portfolios, the analyst draws on county assessor transfer records, certificate-of-occupancy filings and building-permit databases to track new competitive supply entering the submarket. Broker-reported vacancy surveys are cross-referenced against direct canvassing of comparable properties to verify that reported figures reflect current asking rents and actual absorption, not stale listings.
For operating-business assets, demand is re-anchored to industry trade-association data, state licensing registries and, where applicable, utility interconnection queues or regulatory dockets that signal new entrants or capacity changes. Consumer-traffic data, point-of-sale benchmarks and payroll-employment series for the relevant NAICS codes provide a demand-side check independent of the borrower's own reporting.
For renewable-energy or infrastructure assets, offtake contract status, curtailment records filed with the relevant grid operator, and interconnection-queue position reports are reviewed each quarter to confirm that contracted revenue assumptions remain achievable.
In every case the analyst documents the source, the retrieval date and the method used to translate raw data into a revised demand assumption, so the audit trail is complete and the reviewer does not have to accept any figure on faith.
Across asset classes, a small number of inputs account for the majority of movement in the debt-service coverage ratio between quarters. Identifying those inputs at the outset — and testing each one systematically — is what separates a monitoring report from a summary of financial statements.
For most portfolios, the controlling assumptions are:
Each assumption is documented with its source, its underwritten value and its current observed value, so the variance is attributable rather than simply reported.
SBA lenders operating under SOP 50 10 8 are required to monitor covered loans for ongoing compliance with the coverage minimums that supported approval: 1.15 times operating coverage and 1.00 times global coverage. A quarterly monitoring report prepared to those standards gives the lender a documented, independent basis for its annual review file and reduces the risk that a deteriorating credit goes undetected between site visits. Because the monitoring analyst carries a fiduciary duty to the lender rather than to the borrower, the report is not subject to revision based on the borrower's preferred presentation of results.
USDA lenders under RD Staff Instruction 5001 face similar ongoing-reporting obligations across Business & Industry, Community Facilities and REAP programs. Each program has distinct covenant structures and trigger events; the monitoring report maps actual performance to those program-specific thresholds rather than applying a generic coverage test.
Conventional lenders typically set their own coverage floors, commonly 1.20 times, and may require borrower-certified financial statements to be reconciled against an independent calculation. A monitoring engagement built to the lender's stated standard — documented in the original engagement letter — provides that reconciliation without requiring the lender to staff the analysis internally.
Across all three channels, regulators and examiners treat an independent, recurring monitoring record as evidence of sound credit-administration practice. The existence of a structured, third-party report does not guarantee any regulatory outcome, but it does demonstrate that the lender exercised ongoing diligence proportionate to the credit's complexity and size.
Every engagement begins with a fixed fee quoted in writing within one business day of receiving a complete description of the portfolio: number of assets, asset types, reporting currency, existing data-room structure and any program-specific requirements. The fee does not change based on the finding, and no portion of it is contingent on coverage ratios meeting or exceeding any threshold. That structure is not a marketing position; it is the only arrangement consistent with the fiduciary obligation the firm carries to the lender and reviewing agency.
The data room for a quarterly monitoring cycle typically includes trailing-twelve-month and current-quarter financial statements, rent rolls or production logs, updated insurance and tax documentation, and any material lease, contract or regulatory correspondence since the prior report. When the data room is complete, the standard delivery window is ten to fifteen business days. Rush delivery is available and is quoted separately at the time of engagement.
Once the initial monitoring model is built, subsequent quarterly cycles run faster because the workbook structure, the assumption registry and the variance-tracking framework are already in place. Each quarter's report is published to a secure client portal where the financial model remains live: a credit officer can change any input — a revised rent assumption, a new interest rate, an updated expense figure — and the coverage ratios recalculate immediately without submitting a new request.
Engagements covering portfolios with assets in multiple states, multiple asset classes or multiple agency programs are scoped individually, with the deliverable structure and reporting calendar agreed in the engagement letter before work begins.
The fee is fixed and quoted in writing within one business day of receiving a complete portfolio description. It does not vary based on the number of assets performing above or below their coverage thresholds, and no portion is contingent on any finding. Portfolios with multiple asset classes or agency programs are scoped individually; the engagement letter locks the fee before work begins.
Standard delivery is ten to fifteen business days from a complete data room for the reporting period. After the first cycle, subsequent quarters run faster because the model structure, assumption registry and variance framework are already built. Rush delivery is available and is quoted separately at engagement. The completed report is published to a secure client portal the same day it is finalized.
The difficulty is that no single revenue metric — occupancy, utilization, contract price — applies uniformly across asset types, so a blended coverage ratio can mask deterioration in one segment offset by strength in another. Independent monitoring addresses this by calculating coverage at the individual-asset level before rolling figures to the portfolio, and by maintaining a separate assumption registry and variance explanation for each asset class represented in the book.
A monitoring report prepared to SOP 50 10 8 or RD Staff Instruction 5001 standards documents the coverage calculations and variance analysis a lender needs for its annual review file. The report does not guarantee any regulatory outcome, and no agency has endorsed or pre-approved any specific monitoring format. Lenders should confirm with their program officer that the report structure meets their institution's specific compliance obligations.
A standard quarterly cycle requires trailing-twelve-month and current-quarter financial statements, an updated rent roll or production log, current insurance and property-tax documentation, and copies of any material lease amendments, contract changes or regulatory correspondence issued since the prior report. When those items are delivered as a complete data room, the ten-to-fifteen-business-day delivery window begins. Incomplete submissions delay the clock.
A borrower's financial package reports what happened. An independent monitoring report reconciles what happened against what the underwriting assumed would happen, explains the variance, recomputes coverage at the lender's required standard, updates the risk register and stress-tests the assumptions most likely to move the ratio in the next period. The analyst's fiduciary duty runs to the lender, not the borrower, so the figures are not subject to revision based on the borrower's preferred presentation.
Legal disclosure. Wert-Berater, Inc. offices are mailing addresses only. Following the COVID-19 pandemic the firm has elected to work remotely; its office locations receive mail and are not staffed for visitors or in-person meetings. Headquarters mailing address: 1968 South Coast Hwy, Ste 2382, Laguna Beach, CA 92651.
Wert-Berater, Inc. is an independent provider of feasibility studies and other related services. The firm does not provide financing or equity investment advice, and does not arrange, broker, or place debt or equity capital of any kind.
All appraisal assignments are performed by Bruce E. Jones, MAI, ASA-GC, BCA, CMEA, a member of the Appraisal Institute since 2006, a staff member of Wert-Berater, Inc. and owner of Special Purpose Realty Valuation.