
Fourteen Medicare-reporting short-term acute care hospitals operate in Cuyahoga County, Ohio — and thirteen of them belong to just three systems: Cleveland Clinic, University Hospitals, and MetroHealth. Together they run 5,864 certified beds, employ about 54,500 people, and reported $14.55 billion in net patient revenue in cost-report periods ending December 31, 2024. The aggregate tells a strange story — a combined $2.41 billion operating loss alongside $1.25 billion in positive net income — and underneath it sit double-digit-margin suburban hospitals, a deeply subsidized public safety net, four “rural”-classified urban hospitals, and a cluster of small campuses in visible financial distress. This analysis explains what the numbers mean for hospital developers, operators, investors, and lenders.
Evaluating a hospital project, conversion, or expansion? See our hospital feasibility studies — independent, lender-grade analysis covering market demand, reimbursement, and debt capacity.
Want this analysis for your own market? Order a custom hospital or healthcare facility market report for any county or state — from $1,950, delivered in 3–5 business days.
Firm-wide engagement figures are distinct from project-specific findings and their stated source periods.
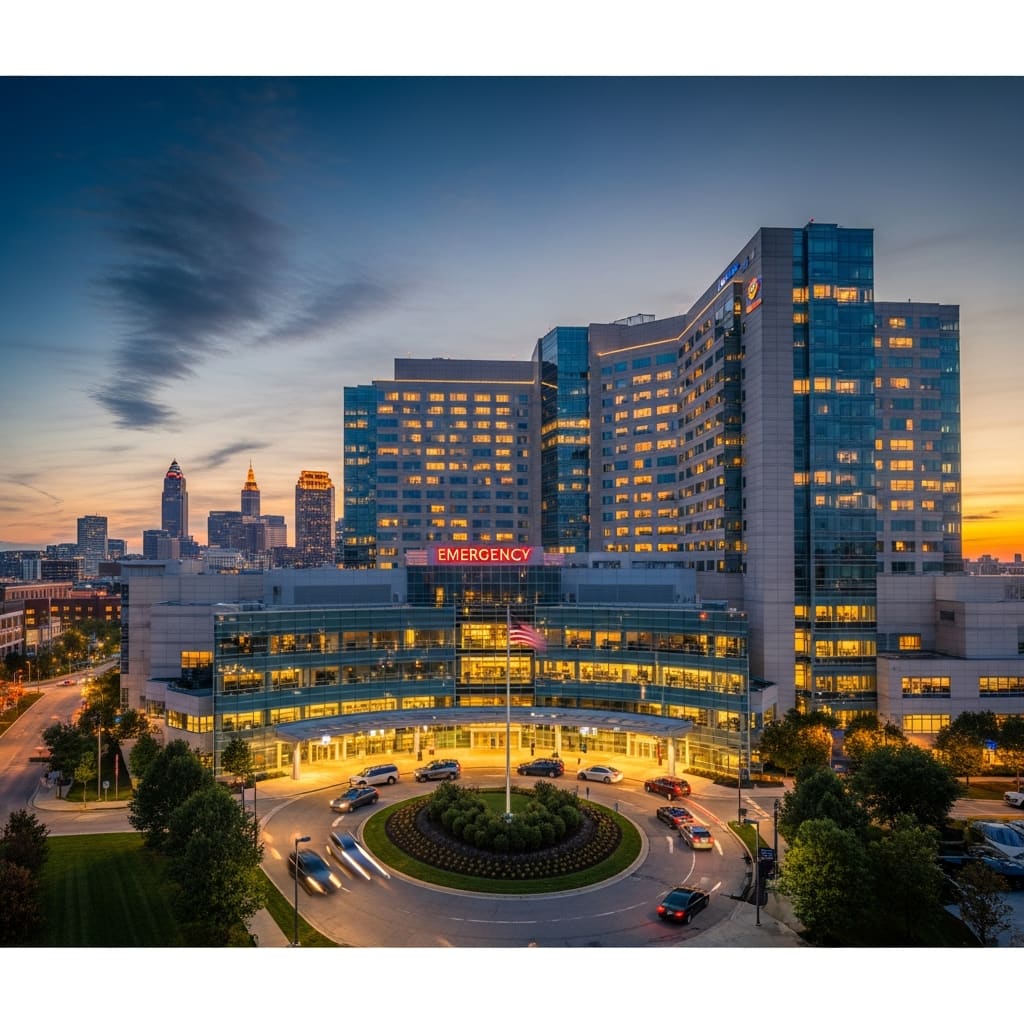
Cuyahoga County — Cleveland and its inner-ring suburbs, roughly 1.23 million residents — hosts one of the most consolidated major hospital markets in the United States. A July 2026 dataset identifies 15 short-term acute care hospitals in the county: seven operated by the Cleveland Clinic Health System, five by University Hospitals, the county-owned MetroHealth Main Campus, independent Southwest General Health Center, and the Louis Stokes Cleveland VA Medical Center, which does not participate in Medicare and files no cost report.
The 14 Medicare-reporting hospitals all filed cost reports for calendar year 2024, making this an unusually clean apples-to-apples market snapshot. Combined, they operate 5,864 Medicare-certified beds, employ about 54,500 people, and reported 221,396 discharges, 1.21 million inpatient days, $55.3 billion in gross patient charges, and $14.55 billion in net patient revenue.
Key finding: Cuyahoga County is a three-system market where the aggregate financials mislead in both directions. The 14 reporting hospitals posted a combined $2.41 billion operating loss — driven almost entirely by system-level expense allocations at Cleveland Clinic Main Campus and MetroHealth — yet finished with $1.25 billion in positive net income once non-operating revenue is counted. Underneath, suburban full-service hospitals earn some of the strongest operating margins in the Midwest while several small campuses run persistent losses with negative liquidity. Reading this market correctly requires hospital-level analysis, not system headlines.
| Indicator | Market result |
|---|---|
| Short-term acute care hospitals identified | 15 (14 file Medicare cost reports) |
| Health-system concentration | 3 systems operate 13 of 14 reporting hospitals |
| Combined Medicare-certified beds | 5,864 |
| Combined employees (reporting hospitals) | ≈54,500 |
| Combined discharges (CY2024) | 221,396 |
| Combined inpatient days | 1,214,576 |
| Average length of stay | 5.5 days |
| Implied aggregate occupancy | ≈57% |
| Combined gross patient revenue | $55.3 billion |
| Combined net patient revenue | $14.55 billion |
| Combined operating income | –$2.41 billion |
| Combined net income | +$1.25 billion |
| Hospitals with positive operating margin | 5 of 14 |
| Hospitals with positive net income | 8 of 14 |
| 340B drug-pricing participants | 6 of 14 |
| Medicare Rural Referral Centers | 4 of 14 |
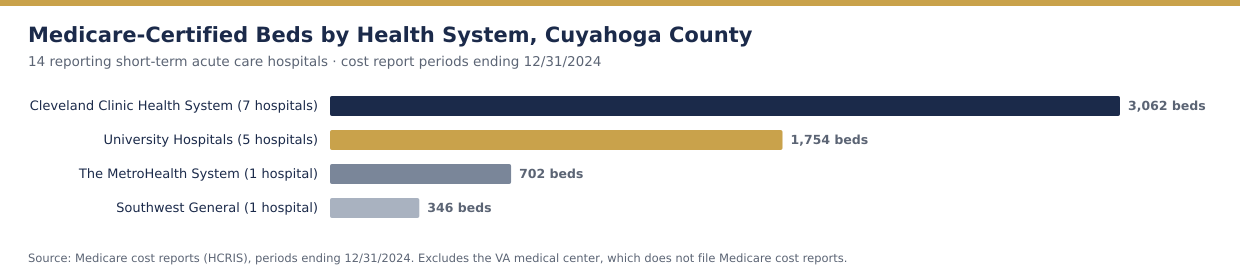
Cleveland Clinic operates seven of the county’s hospitals with 3,062 certified beds — 52% of county capacity — anchored by its 1,267-bed Main Campus, the largest hospital in Ohio. University Hospitals operates five county facilities with 1,754 beds around its 1,037-bed academic flagship, UH Cleveland Medical Center. The MetroHealth System, Cuyahoga County’s public safety-net system, concentrates its acute care at the 702-bed Main Campus. Southwest General Health Center in Middleburg Heights, with 346 beds, is the county’s last remaining independent community hospital — though it operates in clinical affiliation with University Hospitals.
| Hospital | City | System | Certified beds | Discharges | Inpatient days | 340B |
|---|---|---|---|---|---|---|
| Cleveland Clinic Main Campus | Cleveland | Cleveland Clinic | 1,267 | 53,780 | 394,604 | Yes |
| UH Cleveland Medical Center | Cleveland | University Hospitals | 1,037 | 29,970 | 184,181 | Yes |
| MetroHealth Main Campus | Cleveland | MetroHealth (public) | 702 | 21,080 | 115,055 | Yes |
| Fairview Hospital | Cleveland | Cleveland Clinic | 468 | 25,809 | 125,512 | Yes |
| Hillcrest Hospital | Mayfield Heights | Cleveland Clinic | 447 | 26,362 | 128,525 | No |
| CC Marymount Hospital | Garfield Heights | Cleveland Clinic | 349 | 7,570 | 33,688 | No |
| Southwest General Health Center | Middleburg Heights | Independent (UH affiliation) | 346 | 15,398 | 59,246 | No |
| UH Parma Medical Center | Parma | University Hospitals | 309 | 8,283 | 37,680 | No |
| UH Saint John Medical Center | Westlake | University Hospitals | 240 | 6,620 | 25,998 | No |
| CC Lutheran Hospital | Cleveland | Cleveland Clinic | 203 | 4,510 | 16,578 | Yes |
| South Pointe Hospital | Warrensville Heights | Cleveland Clinic | 180 | 7,253 | 31,567 | No |
| Euclid Hospital | Euclid | Cleveland Clinic | 148 | 4,807 | 19,645 | Yes |
| UH Ahuja Medical Center | Beachwood | University Hospitals | 144 | 9,658 | 41,612 | No |
| UH Beachwood Medical Center | Beachwood | University Hospitals | 24 | 296 | 685 | No |
| Combined | — | — | 5,864 | 221,396 | 1,214,576 | 6 of 14 |
Combined inpatient days against certified beds imply aggregate occupancy of roughly 57%, with an average length of stay of about 5.5 days — but the spread is wide. Cleveland Clinic Main Campus runs at roughly 85% implied occupancy while several community campuses sit far below 50%, a dispersion that matters more than the average for anyone modeling inpatient demand in this market.
Four of the county’s hospitals hold Medicare Rural Referral Center status — Cleveland Clinic Main Campus, Fairview Hospital, Hillcrest Hospital, and UH Cleveland Medical Center — and four carry a CMS urban/rural payment designation of “Rural”: MetroHealth, Cleveland Clinic Main Campus, UH Cleveland, and UH Saint John. UH Saint John in suburban Westlake additionally holds Medicare Dependent Hospital status, a classification created for small rural hospitals with high Medicare shares.
None of this reflects geography. Cuyahoga County is Ohio’s most urban county, and these are among its largest institutions. As in other major metropolitan markets, the designations flow from a reclassification pathway in federal law that allows an urban hospital to elect treatment as rural for Medicare payment purposes, unlocking benefits that include uncapped disproportionate-share payments, a lower 340B eligibility threshold, and wage-index flexibility. We analyzed the same phenomenon at larger scale in our companion study of Los Angeles County’s 21 urban Rural Referral Center hospitals — Cleveland’s roster shows the strategy is standard practice among sophisticated systems in every region, not a coastal curiosity.
This county profile illustrates the approach; commission a custom hospital and ASC market report to analyze the specific service area, competitors and facility types behind your decision.
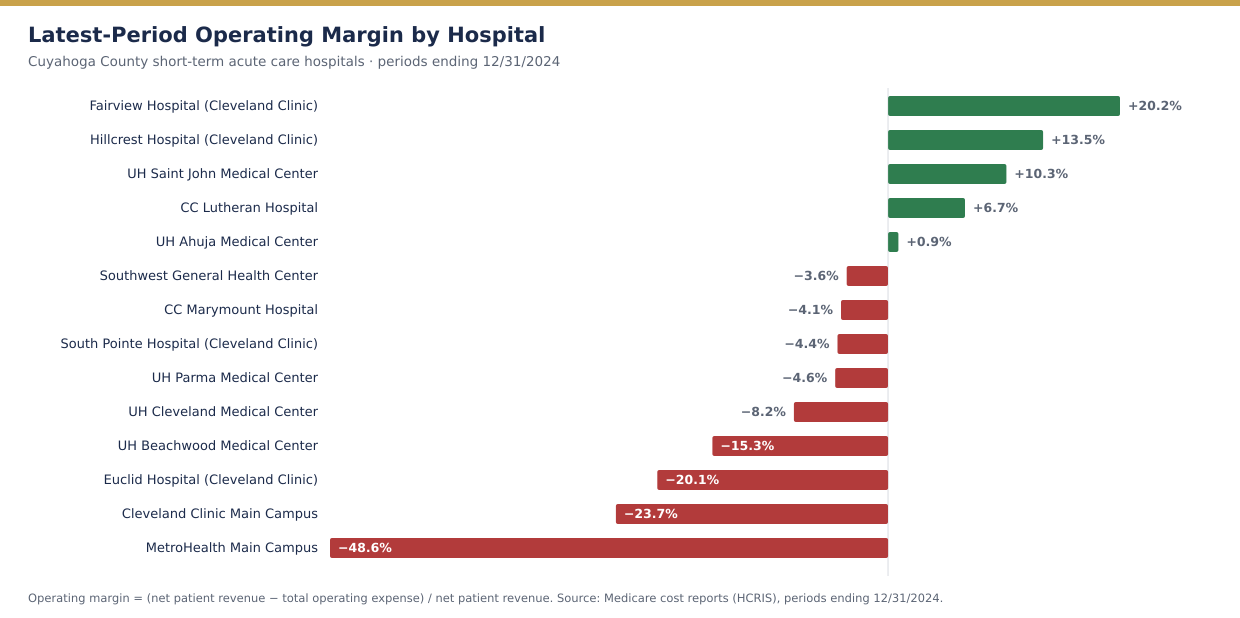
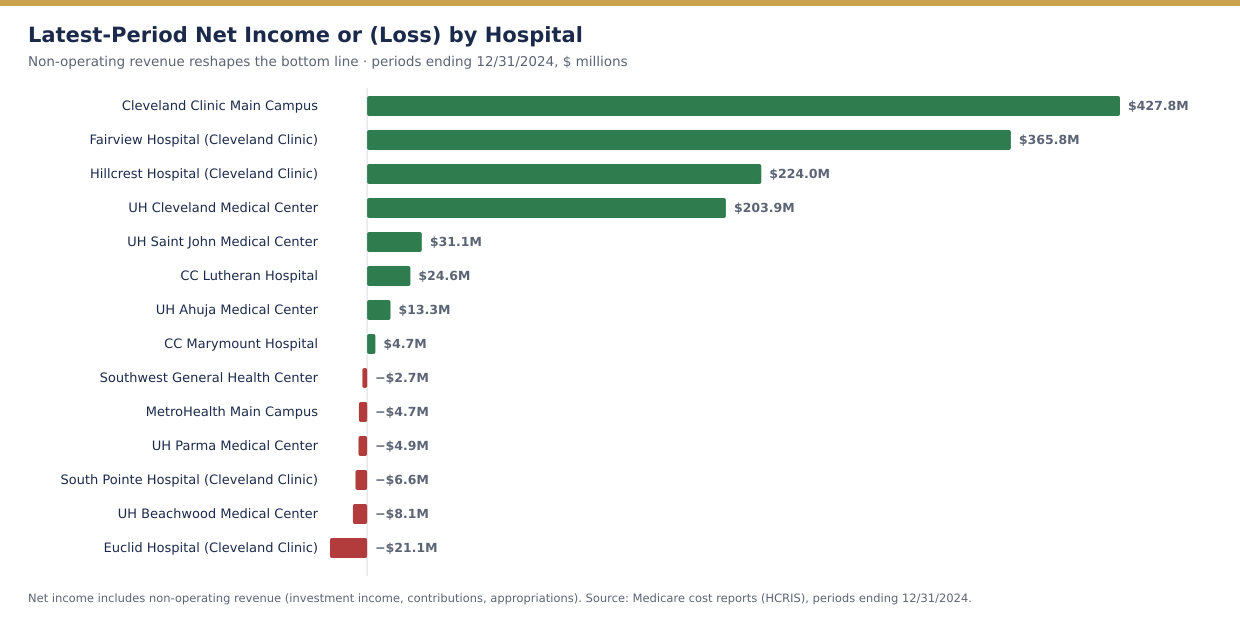
The county’s aggregate operating loss is real arithmetic but misleading economics. Two cost reports drive nearly all of it: Cleveland Clinic Main Campus reported a –$1.76 billion operating loss (–23.7% margin) and MetroHealth a –$660 million loss (–48.6%). Both entities concentrate system-level expenses — research, education, home-office allocations, and in MetroHealth’s case a county safety-net mission supported by public appropriations — on the flagship cost report, while the offsetting resources arrive as non-operating revenue. Main Campus still finished with $427.8 million in net income; MetroHealth finished essentially at break-even (–$4.7 million).
| Hospital | Period end | Net patient revenue | Operating margin | Net income |
|---|---|---|---|---|
| Cleveland Clinic Main Campus | 12/31/2024 | $7,426.5M | –23.7% | $427.8M |
| UH Cleveland Medical Center | 12/31/2024 | $2,464.8M | –8.2% | $203.9M |
| MetroHealth Main Campus | 12/31/2024 | $1,358.0M | –48.6% | –$4.7M |
| Fairview Hospital | 12/31/2024 | $723.4M | +20.2% | $365.8M |
| Hillcrest Hospital | 12/31/2024 | $718.8M | +13.5% | $224.0M |
| Southwest General Health Center | 12/31/2024 | $424.1M | –3.6% | –$2.7M |
| UH Ahuja Medical Center | 12/31/2024 | $312.6M | +0.9% | $13.3M |
| UH Saint John Medical Center | 12/31/2024 | $224.8M | +10.3% | $31.1M |
| UH Parma Medical Center | 12/31/2024 | $223.4M | –4.6% | –$4.9M |
| CC Marymount Hospital | 12/31/2024 | $199.3M | –4.1% | $4.7M |
| CC Lutheran Hospital | 12/31/2024 | $167.2M | +6.7% | $24.6M |
| South Pointe Hospital | 12/31/2024 | $155.2M | –4.4% | –$6.6M |
| Euclid Hospital | 12/31/2024 | $96.8M | –20.1% | –$21.1M |
| UH Beachwood Medical Center | 12/31/2024 | $56.7M | –15.3% | –$8.1M |
| Combined | — | $14,551.6M | — | +$1,247.1M |
Three distinct financial stories sit inside one county:
Fairview Hospital (+20.2% operating margin, $365.8 million net income, 38.8% excess margin) and Hillcrest Hospital (+13.5%, $224.0 million, 197.9 days cash on hand) are the county’s financial engines — large, busy, west- and east-side community hospitals running near-referral-center volumes with community-hospital cost structures. UH Saint John (+10.3%), CC Lutheran (+6.7%), and UH Ahuja (+0.9%, and growing net revenue 15% year-over-year) round out the profitable tier. Notably, Fairview’s and Hillcrest’s net patient revenue grew roughly 40% and 52% respectively between 2020 and 2024 — strong secular growth for mature suburban facilities.
Cleveland Clinic Main Campus ($7.43 billion net patient revenue — 51% of the county total — and $28.8 billion in gross charges, three-quarters of it outpatient) and UH Cleveland Medical Center (–8.2% operating margin, $203.9 million net income) both lose money on operations as reported and recover it through investment income, philanthropy, and system support. The pattern is structural for academic flagships and has persisted across all five reported years. What deserves attention is the trend: Main Campus’s operating margin has deteriorated from –11.8% in 2021 to –23.7% in 2024 even as revenue grew 42%, and MetroHealth’s from –23.8% to –48.6% over the same period — widening dependence on non-operating resources.
Euclid Hospital has lost money in every one of the last five years, posting a –20.1% operating margin, –$21.1 million net loss, negative EBITDAR, and –230.5 days cash on hand in 2024; Cleveland Clinic announced in early 2025 that Euclid’s inpatient operations would be consolidated, consistent with this trajectory. South Pointe (–4.4% operating margin, –267 days cash) and UH Beachwood (a 24-bed, largely outpatient proprietary campus at –15.3%) show related stress. Even solidly run Southwest General slipped to a –3.6% operating margin in 2024 after years near break-even, with just 11 days cash on hand — thin protection for an independent hospital between two giants.
With 57% aggregate occupancy, two entrenched academic systems, and a shrinking-population service area, greenfield inpatient capacity in Cuyahoga County is close to unfinanceable. But the same data show where capital does flow: three-quarters of Cleveland Clinic Main Campus’s gross charges are outpatient, and both systems keep building ambulatory surgery centers, freestanding emergency departments, and outpatient campuses like UH Ahuja and UH Beachwood. Feasibility work in this market is overwhelmingly about ambulatory, post-acute, behavioral, and senior-care assets — and about which submarkets the giants have left underserved.
The county’s money is made in Westlake, Mayfield Heights, and on the west side — not downtown. For a developer siting a surgery center, medical office building, or senior-housing project, the margin geography identifies where commercially insured demand concentrates and which hospital partners have the balance sheets to anchor joint ventures. A capture-rate analysis built on hospital-level (not system-level) financials is the difference between a defensible pro forma and a guess.
Euclid’s inpatient wind-down — and the visible stress at South Pointe and other small campuses — follows a national pattern in which system-owned community hospitals become outpatient, behavioral health, rehabilitation, or senior-care conversions. Each conversion triggers the need for independent market and financial feasibility analysis: for the system, for the acquirer or developer of the vacated campus, and for the lender financing the re-use.
MetroHealth’s –48.6% reported operating margin, offset almost entirely by non-operating support, quantifies how dependent county safety-net capacity is on appropriations, supplemental Medicaid programs, and 340B economics. Any project that assumes MetroHealth’s footprint is static — or that competes for its commercial payer mix — should stress-test scenarios in which public support tightens.
Six of the 14 hospitals participate in 340B and four hold Rural Referral Center status. As in Los Angeles County, designation-linked revenue is woven into the market’s economics — and it is precisely the kind of revenue that federal rulemaking can narrow. Lenders should ask for designation-stress scenarios the same way they ask for interest-rate sensitivity.
| Indicator | Assessment | Interpretation |
|---|---|---|
| Market scale | Major | 14 reporting hospitals, 5,864 beds, $14.55B net patient revenue |
| System concentration | Extreme | Three systems operate 13 of 14 reporting hospitals; one independent remains |
| Inpatient utilization | Soft | ≈57% aggregate occupancy; flagship near-full, several campuses far below 50% |
| Operating profitability | Weak as reported | 5 of 14 positive; aggregate –$2.41B dominated by flagship allocations |
| Bottom-line profitability | Positive but concentrated | 8 of 14 positive; $1.25B combined, led by Main Campus, Fairview, Hillcrest |
| Growth | Strong at the top | County net patient revenue up ≈40% since 2020; flagship and suburban winners drive it |
| Financial dispersion | Extreme | Operating margins span +20.2% to –48.6%; days cash from 197.9 to –267 |
| Distress signals | Present | Euclid: five straight loss years, negative liquidity; South Pointe similar profile |
| 340B participation | Minority | 6 of 14 hospitals |
| Policy risk | Material | Rural designations, 340B, and safety-net funding all subject to federal and county change |
The dataset establishes ownership, utilization, classifications, and cost-report financial performance, but several decisive facts are not visible in public reporting. Before relying on a market thesis in Cuyahoga County — for a development, an acquisition, a conversion, or a financing — the analysis should obtain:
A concentrated three-system market punishes casual analysis. A Wert-Berater hospital feasibility study builds the project case from hospital-level evidence: demand and capture modeling by submarket, competitive capacity mapping that includes the ambulatory networks the cost reports miss, payer-mix and reimbursement analysis including designation-linked revenue, development cost and staffing benchmarks, and base and downside financial scenarios sized to the proposed capital structure.
For an operator or developer, the study determines whether a proposed facility — a surgery center in the western suburbs, a behavioral or post-acute conversion of a consolidating campus, a senior-housing project on the margin map — is feasible under the reimbursement and census it can actually obtain. For a lender, it establishes whether projected cash flow covers debt service when the market’s concentration risk is stressed. For a health system, it evaluates affiliation, acquisition, and re-use candidates on defensible market and financial evidence. Our broader healthcare feasibility studies and ambulatory surgery center feasibility studies apply the same lender-grade discipline across facility types.
And if you are evaluating a different geography, Wert-Berater prepares this same analysis for any county or state in the United States: custom hospital and healthcare facility market reports start at $1,950 and are delivered in 3–5 business days.
Cuyahoga County’s hospital market is really three economies wearing one label: a globally branded academic flagship whose cost report absorbs its system’s ambitions; a ring of suburban full-service hospitals earning margins most markets would envy; and a tail of small campuses whose losses are forcing the consolidation now visibly underway. The aggregate numbers — a $2.41 billion operating loss beside $1.25 billion in net income — are both true, and neither is the story.
For developers, operators, and lenders, the lesson is granularity. System headlines and county averages will mislead in both directions; the margin map, the occupancy dispersion, the designation flags, and the liquidity signals hospital by hospital are where feasibility is actually decided. Model them explicitly, verify them independently, and never let a consolidated brand substitute for facility-level evidence.
Wert-Berater prepares independent feasibility studies for operators, health systems, developers, investors, and lenders — including hospital, ambulatory surgery center, behavioral health, post-acute, and senior-care engagements throughout Ohio and the Midwest. The analysis can evaluate market demand and competitive capacity, payer mix and designation-linked reimbursement, program requirements, development costs, staffing assumptions, break-even utilization, debt-service capacity, and base and downside financial scenarios.
Contact Wert-Berater to evaluate a proposed project, conversion, acquisition, or expansion — or schedule a qualification Zoom to discuss scope.
A July 2026 dataset identifies 15 short-term acute care hospitals in Cuyahoga County: seven Cleveland Clinic Health System hospitals, five University Hospitals facilities, MetroHealth Main Campus, Southwest General Health Center, and the Louis Stokes Cleveland VA Medical Center, which does not participate in Medicare and files no cost report. The 14 Medicare-reporting hospitals operate 5,864 certified beds and reported $14.55 billion in combined net patient revenue in cost-report periods ending December 31, 2024.
Cleveland Clinic Main Campus reported a –23.7% operating margin yet $427.8 million of net income, and MetroHealth reported a –48.6% operating margin while finishing near break-even. Large academic and public systems concentrate system-level expenses — research, education, home-office allocations, and system support — on flagship cost reports, while investment income, philanthropy, and public appropriations appear as non-operating revenue. Facility-level cost-report margins are therefore directional signals of system allocation, not standalone hospital economics, and should never substitute for audited financial statements in a transaction or financing decision.
Four hospitals in the dataset are flagged as Rural Referral Centers: Cleveland Clinic Main Campus, Fairview Hospital, Hillcrest Hospital, and UH Cleveland Medical Center. Four hospitals also carry a CMS urban/rural payment designation of Rural — MetroHealth, Cleveland Clinic Main Campus, UH Cleveland, and UH Saint John — despite operating in Ohio’s most urban county, and UH Saint John additionally holds Medicare Dependent Hospital status. These are paper payment classifications obtained through reclassification, not geographic descriptions.
The market is effectively a three-system oligopoly with high barriers to inpatient entry but meaningful dispersion underneath: suburban full-service hospitals such as Fairview, Hillcrest, and UH Saint John earn double-digit operating margins while several smaller campuses run persistent losses and negative liquidity. That profile points toward outpatient, ambulatory surgery, post-acute, and senior-care opportunities rather than new inpatient beds — and it makes independent market and financial feasibility analysis essential before committing capital on either side of a Cleveland-area healthcare project.
Market structure of this kind is the starting point for a project-specific analysis rather than the conclusion of one. Establishing whether a particular proposed facility can take share from named incumbents, at a payer mix and net reimbursement that carries its cost structure, is the work of a hospital feasibility study prepared for the lender or agency underwriting the request.
Disclaimer: This article is provided for general informational and marketing purposes. It does not constitute legal, accounting, financial, investment, or lending advice, and it is not a feasibility study or an appraisal. Hospital financial figures are drawn from Medicare cost reports and utilization data compiled July 2026 for periods ending December 31, 2024; cost-report entities may include operations beyond a single hospital, and system allocations materially affect facility-level results. Gross patient revenue reflects charges before contractual allowances and is not comparable to net revenue. Medicare classification rules, reimbursement policy, the 340B program, and public safety-net funding are described in general terms only and change through rulemaking, legislation, and local government action; classification flags reflect the dataset date and should be verified against current CMS records. Readers should confirm current requirements with their lender, counsel, and professional advisers before making development or investment decisions.

President, Wert-Berater, Inc. — independent feasibility study consultants since 1998. 4,000+ engagements completed across all 50 states and internationally, evaluating $43.8 billion in project value for SBA, USDA, EB-5, conventional, and institutional financing decisions — including healthcare, medical facility, and lender-reviewed engagements. Fiduciary duty runs to the lender and agency in every engagement.
+1 310-857-2443 ext. 800 · email · 1968 South Coast Hwy, Ste 2382, Laguna Beach, CA 92651 · 111 Town Square Pl Ste 1238 PMB 657834, Jersey City, NJ 07310 · 539 W. Commerce St #8486, Dallas, TX 75208 · 66 W Flagler Street, Suite 900, PMB 12704, Miami, FL 33130
Schedule a ConversationSpeak with Wert-Berater about a proposed hospital, ambulatory surgery center, conversion, acquisition, or expansion in Ohio or any U.S. market. Provide the project location, proposed programs, and lender requirements to receive a project-specific scope. Independent feasibility studies since 1998: 4,000+ engagements, $43.8 billion in evaluated project value.
Legal disclosure. Wert-Berater, Inc. offices are mailing addresses only. Following the COVID-19 pandemic the firm has elected to work remotely; its office locations receive mail and are not staffed for visitors or in-person meetings. Headquarters mailing address: 1968 South Coast Hwy, Ste 2382, Laguna Beach, CA 92651.
Wert-Berater, Inc. is an independent provider of feasibility studies and other related services. The firm does not provide financing or equity investment advice, and does not arrange, broker, or place debt or equity capital of any kind.
All appraisal assignments are performed by Bruce E. Jones, MAI, ASA-GC, BCA, CMEA, a member of the Appraisal Institute since 2006, a staff member of Wert-Berater, Inc. and owner of Special Purpose Realty Valuation.
Thousands of real estate, business, and machinery appraisal and litigation assignments.