
Gas stations are not disappearing — they are evolving. The winners are large-format convenience stores, travel centers, high-throughput forecourts, hybrid foodservice concepts, club-store fuel operations, and strategically located branded dealers with strong access, pricing power, and product mix. This analysis maps where statewide fuel demand appears tightest relative to reported station supply.
Where the opportunity is a highway freight site rather than a neighborhood fuel stop, the analysis differs materially; see our truck stop feasibility study consultant page for how corridor truck counts, diesel capture, and parking demand are modeled.
Firm-wide engagement figures are distinct from project-specific findings and their stated source periods.
Gas stations are not disappearing — they are evolving. The most successful new developments are no longer just fuel islands with a cashier window. The winners are large-format convenience stores, travel centers, high-throughput forecourts, hybrid foodservice concepts, club-store fuel operations, and strategically located branded dealers with strong access, pricing power, and product mix.
The best statewide demand-pressure signals appear in states where estimated gasoline consumption per reported gas station is highest. Based on public estimates, states such as Delaware, Arizona, Hawaii, Maryland, Utah, New Jersey, Florida, California, Nevada, Colorado, and Oregon show above-average fuel demand per reported station. These markets may contain stronger opportunities for new builds, replacement stations, redevelopment, or high-throughput formats — although many also have higher barriers such as land cost, permitting, environmental regulation, or labor constraints.
The strongest practical opportunities are often not the highest-demand states overall, but the places where demand, population growth, highway traffic, freight corridors, and development feasibility overlap. In that sense, Arizona, Florida, Utah, Nevada, Colorado, Texas, Virginia, Washington, North Carolina, South Carolina, and selected Tennessee corridors deserve close review.
The U.S. convenience and fuel retail industry remains massive. As of the 2026 U.S. convenience store count, there were 151,975 convenience stores in the United States, and 122,620 of them sold motor fuels. Convenience stores sell an estimated 80% of the motor fuels purchased in the United States, making c-stores the dominant retail fuel channel.
Fuel, however, is not the whole business model. In 2025, the U.S. convenience store industry generated an estimated $817.5 billion in total sales including fuel, while in-store merchandise and foodservice sales reached $341.2 billion. Fuel represented about 65% of total sales dollars, but only 38.8% of gross profit dollars, while foodservice accounted for 28.5% of inside sales and 38.9% of in-store gross profit dollars.
That margin structure explains why modern gas station development is increasingly tied to food, coffee, quick-service restaurants, loyalty programs, truck/diesel lanes, clean restrooms, EV charging, car washes, and large-format convenience retail. The site that sells the most fuel is often also the site that converts the highest share of fuel customers into in-store customers.
Not all gas stations are equal. Two stations on the same road can have dramatically different gallon volume because fuel sales are driven by a mix of brand, price, access, capacity, and customer mission.
The average U.S. fueling location sells roughly 2,500 gallons per day, but some hypermarket, big-box, club, and large-format travel-center sites can sell many times that amount. NACS notes that hypermarket and big-box fuel sites may sell up to 10 times the gallons of a typical fueling location, while very large convenience brands with extensive fueling positions can also operate far above average.
Several factors explain the difference.
High-volume sites usually sit on strong traffic corridors with easy right-in/right-out access, good visibility, adequate stacking room, and limited friction getting back onto the road. A weaker corner with poor ingress or limited turning movement can underperform even with a strong brand.
A site with 16, 20, or 24 fueling positions can process more vehicles during peak demand than a legacy 4- or 6-dispenser station. Capacity matters most during commuting peaks, tourist travel, evacuation periods, and freight-heavy periods.
Club stores, hypermarkets, and aggressive regional chains often gain volume by being perceived as the lowest-price option. A few cents per gallon can shift meaningful volume in price-sensitive trade areas.
Fuel customers do not choose only on gasoline. They choose clean restrooms, safe lighting, coffee, prepared food, snacks, quick checkout, loyalty rewards, and brand familiarity. A strong inside offer can make a station the default stop.
Stations with high-speed diesel, DEF, truck access, fleet-card acceptance, and trailer-friendly circulation can capture demand that small urban forecourts cannot.
Major oil brands, strong regional c-store chains, and high-loyalty travel-center operators can outperform independents when consumers value fuel quality, rewards, safety, and transaction reliability.
Markets with fuel formulation requirements, limited real estate, full-service rules, high environmental compliance costs, or constrained permitting may have fewer viable new sites. Existing operators in those markets may benefit from high throughput, but new entrants may face higher development risk.
The word “franchise” is often used broadly in gas station development, but the industry includes several different ownership and operating structures. Many fuel sites are not pure franchises; they may be branded dealers, distributor-supplied locations, corporate stores, lessee-dealer sites, independent operators, or membership-club fuel centers. See our franchise underwriting guide for how lenders weigh these structures.
This includes sites operating under major fuel brands through supply agreements or dealer relationships. The operator benefits from brand recognition, card acceptance, fuel-quality perception, and established supply channels. The trade-off is less flexibility on branding, supply, image standards, and sometimes pricing structure. Best fit: suburban arterials, commuter corridors, established neighborhoods, and markets where brand trust matters.
Regional and national c-store brands often win because they combine fuel volume with strong in-store sales. The real profit engine may be foodservice, beverages, private-label items, car wash, and loyalty programs. Best fit: growth suburbs, commuter routes, mixed residential-commercial corridors, and underserved towns with outdated legacy stations.
Warehouse clubs and large retailers often use fuel as a traffic driver. They may sell high volumes at lower margins because fuel supports memberships or grocery trips. Best fit: retail power centers, high-income suburban nodes, and areas with large parking fields and heavy repeat traffic.
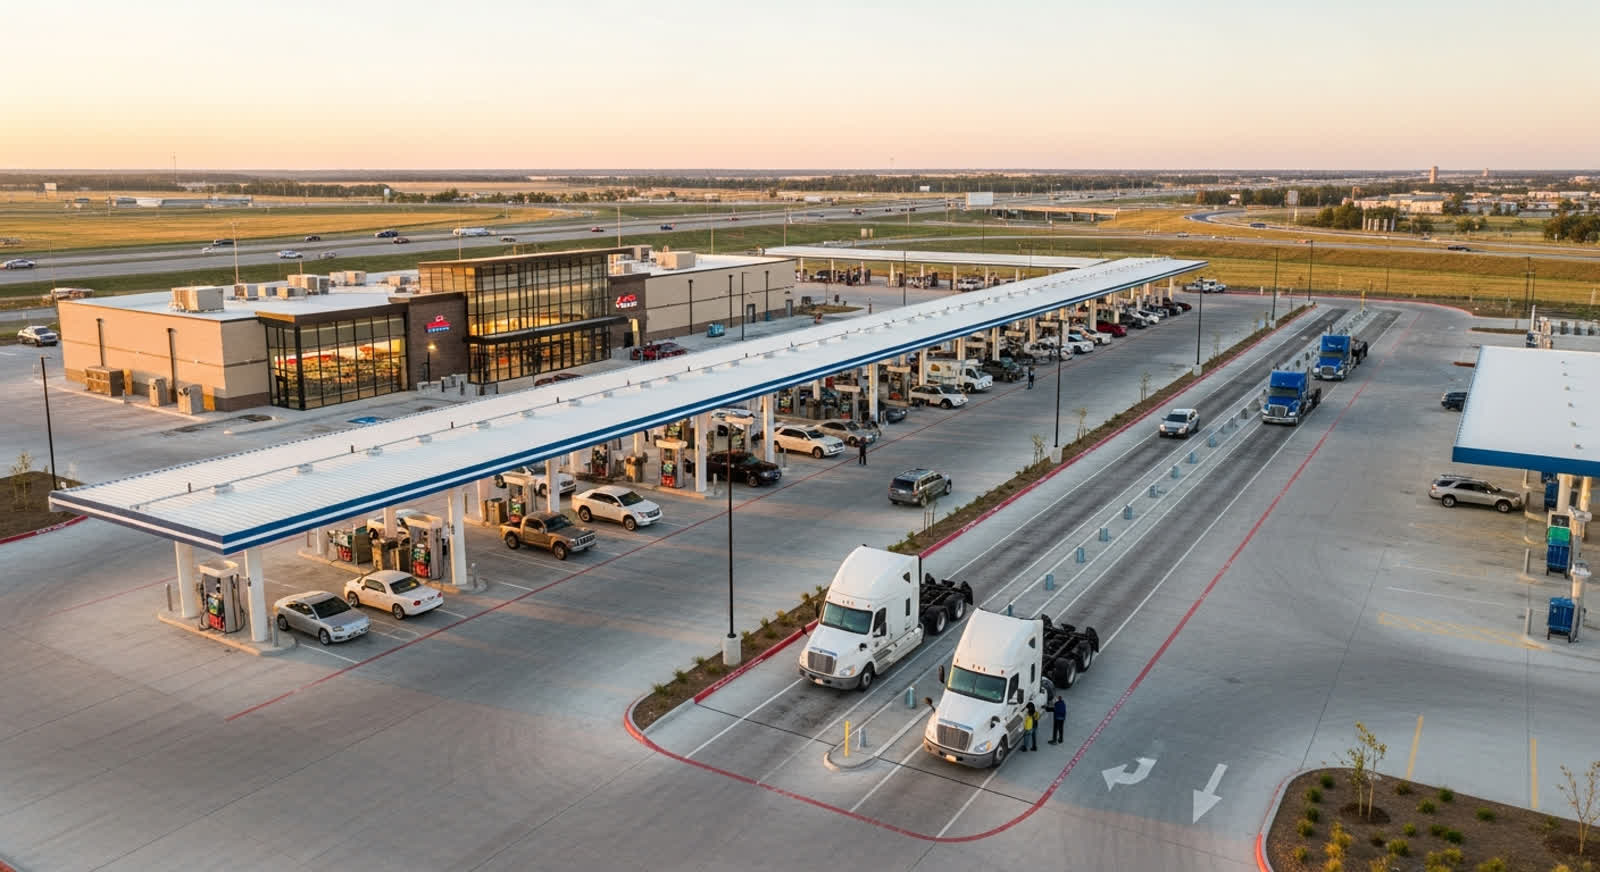
Travel centers are built for long-haul traffic, diesel, restrooms, showers, food, parking, and fleet services. These sites require larger parcels and higher capital investment but can generate major fuel volume. Best fit: interstate exits, logistics corridors, ports, warehouse clusters, and rural highway gaps. See our travel center & truck stop feasibility page.
Independent stations may compete on price, location, local ownership, ethnic grocery, repair services, or convenience. They have more flexibility but less brand support. Best fit: rural towns, urban infill, redevelopment sites, and markets where branded supply economics are less attractive.
In mature markets, the biggest opportunity is often not another station — it is replacing a weak station. Old tanks, poor lighting, too few dispensers, dated stores, and limited foodservice can leave room for modern operators to take share. Best fit: dense metros, older suburbs, constrained coastal markets, and corridors with obsolete forecourts.
Fuel mix matters because the right product slate can increase gallons, attract fleets, and improve the site’s competitive position.
Retail gasoline is typically sold in three octane grades. Regular gasoline is usually 87 octane, midgrade is generally 89 to 90 octane, and premium is generally 91 to 94 octane. Premium share can be higher in affluent markets, luxury-vehicle markets, tourist destinations, and states with higher concentrations of performance vehicles. Regular fuel dominates most everyday consumer demand.
Gasoline formulation varies by location and season. EIA notes that gasoline sold in the United States varies based on crude oil source, refinery processing, blending components, environmental rules, and seasonal vapor-pressure requirements. Summer gasoline is typically formulated differently than winter gasoline to help reduce evaporative emissions.
Reformulated gasoline, or RFG, is required in certain high-smog areas under the Clean Air Act. EPA states that RFG is currently sold in parts of 17 states and the District of Columbia, and that about 25% of gasoline sold in the United States is reformulated. California has its own statewide reformulated gasoline program.
Most finished gasoline sold in the United States contains ethanol, commonly around 10% ethanol, known as E10. EIA describes E10, E15, and E85 as the primary ethanol-gasoline blends. E15 contains more than 10% and up to 15% ethanol, while E85 is a high-level blend for flexible-fuel vehicles and can range from 51% to 83% ethanol depending on season and geography.
The U.S. Department of Energy’s Alternative Fuels Data Center notes that E10 is available at nearly every fueling station, while E15 and E85 are much less common. As of 2023, E15 was sold at more than 3,000 stations in 31 states, and E85 was available at more than 4,200 public stations in 43 states.
Diesel is critical for travel centers, logistics corridors, agricultural regions, construction markets, and fleet-heavy locations. Biodiesel blends are also part of the retail and fleet fuel mix. AFDC identifies B5 and B20 as common biodiesel blends, while B100 is usually used as a blendstock rather than as the typical retail product. B20 is common because it balances cost, emissions benefits, cold-weather performance, and vehicle compatibility.
For gas station developers, the key question is not simply whether to sell diesel, but whether the site can physically support diesel customers: larger turning radius, canopy height, high-speed dispensers, DEF, trailer access, truck parking, and fleet-card acceptance.
Once a state shortlist exists, the next step is county and corridor evidence — custom gas station and truck stop market reports rank candidate markets on competition, traffic and access.
The estimate combines:
The result is not a forecast of site-level performance. It is a statewide signal showing where gasoline demand appears high relative to the number of reported stations.
| Demand signal | Est. gallons/day per reported station | Interpretation |
|---|---|---|
| High | 3,900+ | Strong statewide pressure; worth deeper site screening |
| Moderate-high | 3,300–3,899 | Attractive but requires corridor-level validation |
| Targeted infill | 2,700–3,299 | Opportunities likely exist in specific metros, exits, or growth nodes |
| Selective/lower | Below 2,700 | More replacement, modernization, or niche opportunities than broad new-build demand |
Public estimates may be outdated. Directional only.
| State | 2024 gasoline demand (million barrels) | Reported gas stations, 2023 | Est. gallons/day per station | Demand signal | Development angle |
|---|---|---|---|---|---|
| Alabama | 76.5 | 3,089 | 2,850 | Targeted infill | I-65, I-20, and replacement sites |
| Alaska | 6.0 | 200 | 3,470 | Moderate-high | Diesel, remote travel hubs, fleet supply |
| Arizona | 68.5 | 1,594 | 4,950 | High | Phoenix/Tucson exurbs, I-10, I-17 |
| Arkansas | 35.4 | 1,386 | 2,940 | Targeted infill | I-40 and I-49 truck/convenience sites |
| California | 294.8 | 8,116 | 4,180 | High | Redevelopment, high-density suburbs, alternative fuels |
| Colorado | 52.5 | 1,513 | 3,990 | High | Front Range, I-70, growth suburbs |
| Connecticut | 34.6 | 1,060 | 3,760 | Moderate-high | I-95 and I-84 infill |
| Delaware | 11.4 | 239 | 5,490 | High | I-95, beach routes, tax/travel demand |
| Florida | 216.6 | 5,928 | 4,210 | High | Growth suburbs, tourism corridors, evacuation routes |
| Georgia | 113.2 | 5,102 | 2,550 | Selective/lower | Select I-75/I-95 sites and foodservice upgrades |
| Hawaii | 9.5 | 238 | 4,590 | High | Tourism, fleet, island-specific supply nodes |
| Idaho | 17.3 | 646 | 3,070 | Targeted infill | Boise/Treasure Valley and I-84 |
| Illinois | 95.3 | 3,819 | 2,870 | Targeted infill | Chicago-area redevelopment, I-55/I-80 |
| Indiana | 68.3 | 2,885 | 2,720 | Targeted infill | I-65, I-70, I-80 diesel corridors |
| Iowa | 35.2 | 1,680 | 2,410 | Selective/lower | I-80 modernization, ethanol-heavy markets |
| Kansas | 31.4 | 1,034 | 3,490 | Moderate-high | I-35 and I-70 travel centers |
| Kentucky | 51.1 | 1,990 | 2,960 | Targeted infill | I-65 and I-75 corridor c-stores |
| Louisiana | 50.4 | 2,237 | 2,590 | Selective/lower | Ports, industrial corridors, resilience-focused sites |
| Maine | 15.2 | 676 | 2,590 | Selective/lower | Seasonal tourism and targeted rural service |
| Maryland | 54.3 | 1,388 | 4,500 | High | DC/Baltimore, I-95, I-270 |
| Massachusetts | 58.0 | 1,967 | 3,390 | Moderate-high | Urban redevelopment and high-density infill |
| Michigan | 101.5 | 3,540 | 3,300 | Targeted infill | I-75, I-94, and suburban replacement |
| Minnesota | 56.0 | 2,038 | 3,160 | Targeted infill | Twin Cities growth and lake-route demand |
| Mississippi | 39.0 | 1,895 | 2,370 | Selective/lower | Select corridor gaps and modernization |
| Missouri | 74.6 | 2,635 | 3,260 | Targeted infill | I-70, I-44, Kansas City–St. Louis axis |
| Montana | 12.7 | 489 | 2,990 | Targeted infill | Tourism, long-haul diesel, rural highway gaps |
| Nebraska | 20.8 | 972 | 2,470 | Selective/lower | I-80 modernization more than broad new builds |
| Nevada | 26.9 | 753 | 4,110 | High | Las Vegas, Reno, I-15, I-80 |
| New Hampshire | 16.3 | 551 | 3,400 | Moderate-high | I-93, I-95, tax-border fuel demand |
| New Jersey | 81.7 | 2,222 | 4,230 | High | High-throughput branded sites, dense corridors |
| New Mexico | 21.7 | 785 | 3,180 | Targeted infill | I-40, I-25, tribal/fleet opportunities |
| New York | 119.8 | 4,419 | 3,120 | Targeted infill | Suburban, tourist, and corridor-specific infill |
| North Carolina | 119.6 | 4,256 | 3,230 | Targeted infill | Growth suburbs, I-40, I-85, I-95 |
| North Dakota | 9.5 | 441 | 2,470 | Selective/lower | Oilfield and fleet-focused selective sites |
| Ohio | 109.7 | 3,873 | 3,260 | Targeted infill | I-70, I-75, I-80, suburban redevelopment |
| Oklahoma | 44.3 | 1,799 | 2,830 | Targeted infill | I-35, I-40, I-44 fleet corridors |
| Oregon | 32.4 | 954 | 3,910 | High | I-5, Portland metro, high-barrier infill |
| Pennsylvania | 101.6 | 3,643 | 3,210 | Targeted infill | Turnpike, I-81, replacement of older stores |
| Rhode Island | 8.5 | 296 | 3,300 | Moderate-high | Dense urban infill and commuter corridors |
| South Carolina | 65.0 | 2,495 | 3,000 | Targeted infill | I-95, Greenville-Spartanburg, Charleston |
| South Dakota | 11.0 | 580 | 2,190 | Selective/lower | Seasonal interstate tourism |
| Tennessee | 80.4 | 3,442 | 2,690 | Selective/lower | Nashville, I-40, I-65 selective opportunities |
| Texas | 340.9 | 10,670 | 3,680 | Moderate-high | Exurban growth, freight corridors, travel centers |
| Utah | 30.2 | 813 | 4,280 | High | I-15, Wasatch Front, St. George |
| Vermont | 6.5 | 385 | 1,930 | Selective/lower | Tourism, rural service, EV/hybrid formats |
| Virginia | 93.3 | 2,817 | 3,810 | Moderate-high | Northern Virginia, I-95, I-81 |
| Washington | 59.2 | 1,806 | 3,770 | Moderate-high | I-5, Seattle/Tacoma infill, high-barrier sites |
| West Virginia | 17.1 | 879 | 2,240 | Selective/lower | Appalachian corridor replacement |
| Wisconsin | 57.5 | 2,533 | 2,610 | Selective/lower | I-90/I-94 and tourism-oriented modernization |
| Wyoming | 8.1 | 325 | 2,880 | Targeted infill | I-80, I-25, long-haul diesel |
The highest estimated demand-per-station markets are not automatically the easiest development markets. A high-demand state can still be difficult because of land scarcity, entitlement delays, underground storage tank regulation, environmental permitting, wage structure, taxes, full-service rules, or fuel formulation complexity.
The strongest statewide signals are Delaware, Arizona, Hawaii, Maryland, Utah, New Jersey, Florida, California, Nevada, Colorado, and Oregon. These states appear to have high gasoline demand relative to reported station supply. They should be screened for new development, but the strategy should differ by state.
For example, Arizona, Utah, Nevada, Colorado, and Florida may support more growth-oriented development because of suburban expansion, highway traffic, tourism, and population movement. California, New Jersey, Maryland, Hawaii, and Oregon may show strong demand pressure but can be more challenging because of land constraints, permitting, environmental rules, labor rules, or fuel formulation requirements.
A practical development shortlist would likely include:
| Market | Why it stands out |
|---|---|
| Arizona | Strong estimated gallons per station, population growth, large exurban corridors, and interstate traffic |
| Florida | Very large gasoline demand, tourism, commuter traffic, evacuation-route importance, and continued suburban growth |
| Utah | High demand per station and strong growth along the Wasatch Front and I-15 |
| Nevada | Strong travel corridors, Las Vegas and Reno growth, and long-distance highway demand |
| Colorado | Front Range growth, mountain travel, and I-70 corridor demand |
| Texas | Not the highest per-station estimate, but the largest gasoline market by volume in the table, with major exurban growth and freight corridors |
| Virginia | Strong demand signal around Northern Virginia, I-95, and I-81 |
| Washington | High demand per station, though land and permitting constraints can be significant |
| North Carolina & South Carolina | More targeted than statewide, but attractive in fast-growing suburbs and interstate corridors |
In many states, the best opportunity is not adding a basic station. It is replacing obsolete supply. A modern development can outperform older competitors by offering:
This matters because fuel itself is often a thin-margin product. NACS estimates that recent gasoline gross margins have been around the mid-30-cents-per-gallon range, but after expenses, profit can be closer to the low-teens cents per gallon before taxes. That is why the highest-performing gas station developments are designed as retail platforms, not just fuel outlets.
This is the most scalable format for suburban and highway-adjacent growth markets. It works best where land is available, traffic counts are high, and nearby competition is older or capacity-constrained.
This format works best in freight-heavy markets with truck traffic, long-haul routes, limited competition, and room for diesel lanes, truck parking, foodservice, and restrooms.
In dense markets, new sites are hard to entitle. Redeveloping an existing station with modern tanks, dispensers, canopy, lighting, store design, and foodservice may be more viable than greenfield construction.
These sites can generate very high gallon volumes, but they are usually tied to a larger retail anchor. They are strongest in suburban trade areas with high household density and strong repeat shopping patterns.
In rural counties, the opportunity is often broader than fuel. The winning format may combine gasoline, diesel, convenience, food, restrooms, agricultural supply, propane, truck access, and local services.
Gas station development is capital-intensive and heavily regulated. Before pursuing a site, developers should evaluate:
| Risk | What to evaluate |
|---|---|
| Environmental risk | Underground storage tanks, soil contamination, groundwater issues, vapor intrusion, and remediation exposure |
| Permitting risk | Zoning, conditional-use permits, traffic studies, stormwater, signage, canopy restrictions, and local opposition |
| Access risk | A visible parcel can still fail if turning movements, median cuts, or traffic stacking are weak |
| Margin risk | Gallons alone do not guarantee profitability. The model must include fuel margin, credit-card fees, labor, shrink, utilities, insurance, rent or debt service, and in-store gross margin |
| EV transition risk | EV adoption does not eliminate near-term gasoline demand, but it changes long-term site planning. New developments should consider electrical capacity, dwell time, charger placement, and future conversion options |
| Brand and supply risk | Branded supply terms, rack pricing, image requirements, dealer agreements, and distributor relationships can materially affect profitability |
Gas station development opportunity in America is highly uneven. Some states show strong statewide fuel-demand pressure, while others are better suited for selective corridor plays, redevelopment, or modernization rather than broad new construction.
Translating that state-level white space into a financeable project requires a site-level test of traffic, capture and margin. Wert-Berater prepares an independent gas station feasibility analysis for lenders, CDCs and agency reviewers on precisely that question.
The most attractive opportunities are likely in markets where four conditions overlap:
Based on public estimates, the strongest statewide white-space signals appear in Delaware, Arizona, Hawaii, Maryland, Utah, New Jersey, Florida, California, Nevada, Colorado, and Oregon. The most practical growth-oriented development markets may be Arizona, Florida, Utah, Nevada, Colorado, Texas, Virginia, Washington, North Carolina, and South Carolina, with opportunities concentrated in growth suburbs, interstate corridors, logistics markets, and obsolete legacy-station clusters.

President, Wert-Berater, Inc. — independent feasibility study consultants since 1998. 4,000+ engagements completed across all 50 states and internationally, evaluating $43.8 billion in project value for SBA, USDA, EB-5, conventional, and institutional financing decisions. Fiduciary duty runs to the lender and agency in every engagement.
+1 310-857-2443 ext. 800 · email · 1968 South Coast Hwy, Ste 2382, Laguna Beach, CA 92651 · 111 Town Square Pl Ste 1238 PMB 657834, Jersey City, NJ 07310 · 539 W. Commerce St #8486, Dallas, TX 75208 · 66 W Flagler Street, Suite 900, PMB 12704, Miami, FL 33130
Schedule a ConversationIndependent feasibility studies since 1998 — 4,000+ engagements, $43.8 billion in evaluated project value. Standard delivery in 10 to 15 business days. Fiduciary duty to the lender and agency.
Legal disclosure. Wert-Berater, Inc. offices are mailing addresses only. Following the COVID-19 pandemic the firm has elected to work remotely; its office locations receive mail and are not staffed for visitors or in-person meetings. Headquarters mailing address: 1968 South Coast Hwy, Ste 2382, Laguna Beach, CA 92651.
Wert-Berater, Inc. is an independent provider of feasibility studies and other related services. The firm does not provide financing or equity investment advice, and does not arrange, broker, or place debt or equity capital of any kind.
All appraisal assignments are performed by Bruce E. Jones, MAI, ASA-GC, BCA, CMEA, a member of the Appraisal Institute since 2006, a staff member of Wert-Berater, Inc. and owner of Special Purpose Realty Valuation.
Thousands of real estate, business, and machinery appraisal and litigation assignments.