
The United States fertilizer industry is entering a significant investment cycle. USDA’s FIELDS program has made at least $500 million available for domestic fertilizer production — but a successful application must show that a specific product can be sold competitively, in sufficient volume, within a clearly defined geographic market. This analysis covers U.S. fertilizer demand by nutrient, import exposure by product, July 2026 prices, and regional buying patterns — the market evidence a FIELDS feasibility study must marshal.
Preparing a FIELDS application? Start with our USDA FIELDS Feasibility Study Guide — the program, the application package, and the seven required study components.
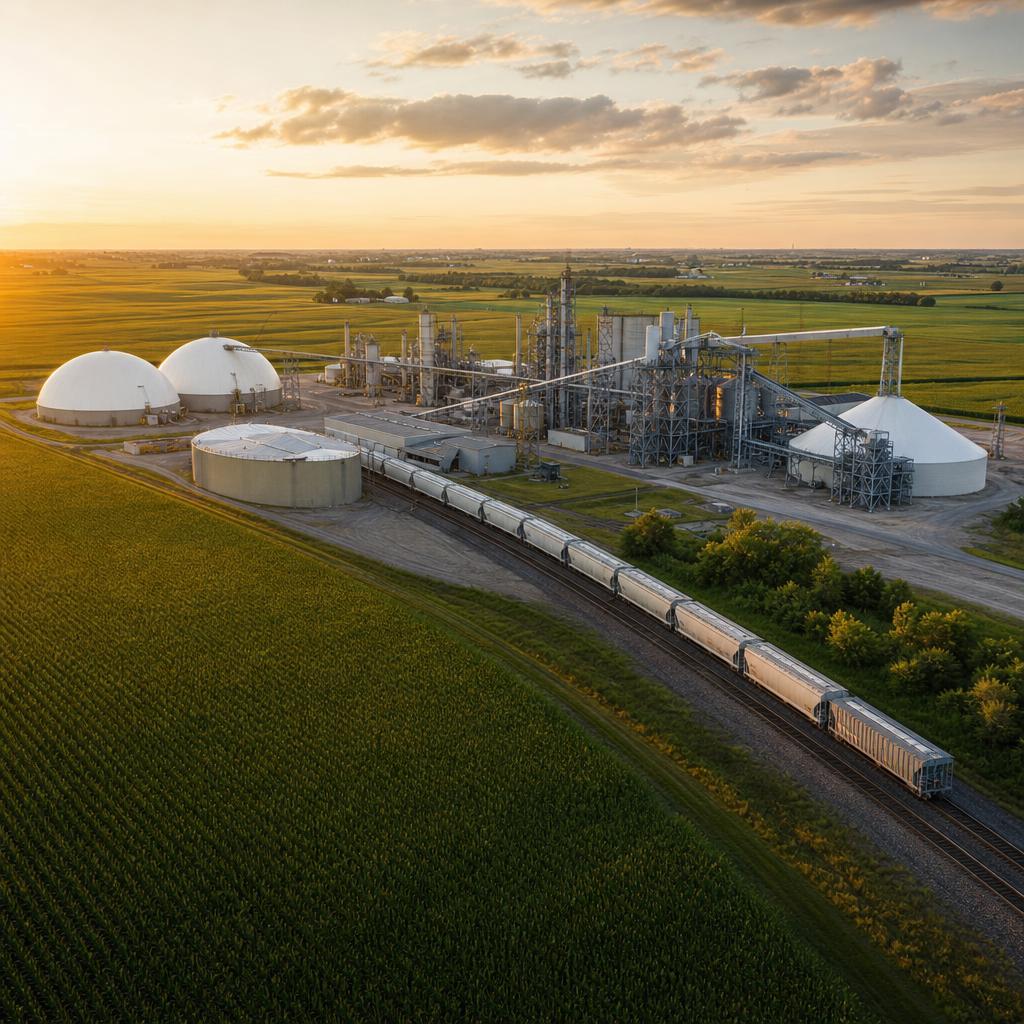
In July 2026, the U.S. Department of Agriculture opened the Fertilizer Investment & Expansion for Long-term Domestic Supply Program, commonly known as FIELDS. The program is intended to increase independent domestic fertilizer manufacturing, give farmers more supply options and reduce vulnerabilities within the agricultural-input supply chain. USDA has made at least $500 million available for construction, expansion and modernization projects.
For fertilizer manufacturers, project developers, cooperatives and investors, the opportunity is substantial. However, a successful project must demonstrate more than technical production capacity. It must show that a specific fertilizer product can be sold competitively, in sufficient volume, within a clearly defined geographic market.
That requires understanding U.S. fertilizer demand by nutrient, import exposure, prevailing prices, crop geography, transportation costs and regional buying patterns.
FIELDS supports new or expanded domestic process-manufacturing capacity for nitrogen, phosphate, potash, sulfur and other crop nutrients. Eligible investments can include:
Logistics may be included, but it cannot be the project’s primary use of funds. Projects must be located in the United States or its territories, be domestically owned and comply with applicable federal, state, Tribal and local fertilizer-manufacturing regulations.
The current application period closes at 11:59 p.m. Eastern Time on August 17, 2026. Awards are expected to range from $15 million to $150 million, with approximately 10 awards anticipated. The program also requires applicants to document matching funds and submit a project-specific feasibility study prepared by a qualified independent consultant. For the full program breakdown, see our FIELDS Feasibility Study Guide and FIELDS matching-funds explainer.
The most recent comprehensive USDA cross-product analysis uses 2022 supply data and reports volumes in metric tons of nutrient, rather than the gross weight of fertilizer products. In 2022, the United States:
| Supply measure | Volume |
|---|---|
| Produced fertilizer nutrients | 36.6 million metric tons |
| Imported fertilizer nutrients | 10.7 million metric tons |
| Exported fertilizer nutrients | 3.2 million metric tons |
| Recorded apparent consumption | 43.3 million metric tons |
On this basis, imports were equal to approximately one-quarter of U.S. apparent consumption. Apparent consumption is calculated from production, imports and exports; it includes material available for agricultural, feed and industrial applications and should not be interpreted as farm use alone.
Nitrogen remains the dominant nutrient category. USDA found that U.S. nitrogen fertilizer consumption exceeded phosphate and potash consumption combined throughout the study period. By 2022, nitrogen also accounted for 61% of U.S. fertilizer production, replacing phosphate as the country’s largest production category.
The following table shows the leading fertilizer products and feedstocks in USDA’s 2022 supply dataset.
| Fertilizer or feedstock | U.S. apparent consumption | Imports | Import share |
|---|---|---|---|
| Ammonia | 14.94 million metric tons | 1.88 million | 12.6% |
| Phosphate rock | 6.51 million metric tons | 750,000 | 11.5% |
| Urea | 6.51 million metric tons | 2.31 million | 35.4% |
| Potassium chloride | 4.62 million metric tons | 4.47 million | 96.8% |
| Phosphoric acid | 4.39 million metric tons | 233,000 | 5.3% |
| Ammonium nitrate | 2.82 million metric tons | 93,000 | 3.3% |
| Monoammonium phosphate (MAP) | 1.79 million metric tons | 467,000 | 26.2% |
| Diammonium phosphate (DAP) | 972,000 metric tons | 208,000 | 21.4% |
| Ammonium sulfate | 614,000 metric tons | 159,000 | 25.9% |
| Triple superphosphate | 147,000 metric tons | 147,000 | 100% |
Volumes are expressed as metric tons of nutrient, not total product weight. Percentages are calculated from USDA’s published import and apparent-consumption figures.
These figures reveal that the U.S. fertilizer market is not uniformly dependent on imports. Import exposure varies greatly by product.
Potassium chloride, commonly sold as muriate of potash or MOP, stands out. Domestic production supplied less than 5% of U.S. potash requirements in 2022. In the earlier 2017–2021 period, approximately 75% of U.S. potash imports came from Canada, 10% from Russia and 8% from Belarus.
This dependence creates a strong supply-chain case for domestic potash projects. However, potash mining and processing projects usually require substantial capital, lengthy permitting, mineral-resource verification and specialized transportation infrastructure.
Urea had approximately 6.5 million metric tons of apparent nutrient consumption in 2022, including more than 2.3 million metric tons of imports — an estimated import ratio of about 35%.
Domestic urea projects can benefit from the United States’ natural-gas resource base, but their feasibility remains sensitive to natural-gas prices, ammonia availability, plant scale, carbon dioxide supply and rail or barge access.
Phosphate rock production is concentrated in Florida, North Carolina, Idaho and Utah. Historically, Florida and North Carolina have accounted for more than three-quarters of U.S. phosphate-rock production. More than 95% of output has been used to manufacture ammonium phosphate fertilizers and animal-feed supplements.
MAP and DAP remain important products for corn, wheat, soybean and specialty-crop production. Their import ratios are lower than potash’s, but domestic projects can still create value through geographic diversification, reduced freight costs, granulation capacity or access to underserved markets.
Fertilizer prices change throughout the crop year and vary by region, delivery terms, order size and transportation mode. The following figures are national retail averages reported for July 13–17, 2026.
| Fertilizer type | Typical analysis | Average retail price |
|---|---|---|
| Anhydrous ammonia | 82-0-0 | $967 per ton |
| Urea | 46-0-0 | $682 per ton |
| UAN 28 | 28-0-0 | $480 per ton |
| UAN 32 | 32-0-0 | $465 per ton |
| DAP | 18-46-0 | $911 per ton |
| MAP | Commonly 11-52-0 | $958 per ton |
| Potash | 0-0-60 | $494 per ton |
| Liquid starter fertilizer | 10-34-0 | $719 per ton |
During that reporting period, anhydrous ammonia, urea, UAN 28 and UAN 32 had declined from their June levels, while DAP and MAP were slightly higher. Even after the monthly declines, all eight products remained more expensive than one year earlier.
On an actual-nutrient basis, the reported average nitrogen costs were approximately:
These prices are useful market benchmarks, but a FIELDS feasibility study should not simply insert a national average into its financial model. A defensible sales forecast should use regional delivered prices, current customer quotations, seasonal pricing, freight costs, storage expenses, distributor margins and conservative price scenarios.
Fertilizer demand follows crop acreage, application rates, soil conditions, irrigation, weather, local nutrient-management practices and access to transportation.
USDA data demonstrate how widely fertilizer expenditures can vary. In 2023, corn fertilizer costs averaged $238.57 per acre in the Southern Seaboard, compared with $127.88 per acre in the Prairie Gateway. Wheat fertilizer costs ranged from $107.42 per acre in the Heartland to $57.98 per acre in the Fruitful Rim.
The following regional assessment uses relative volume categories rather than unsupported tonnage estimates.
The Heartland is the largest bulk-fertilizer opportunity because of its concentration of corn acreage and high nitrogen requirements. Corn production supports large spring and fall application windows for anhydrous ammonia, liquid nitrogen and dry urea. Phosphate and potash demand is also significant, although application timing may be more flexible.
Projects serving this region benefit from rail, barge and highway access, high-volume distributors and proximity to established blending and storage systems. Large-scale ammonia, urea, UAN, granulation and regional-terminal projects are likely to find the deepest potential customer base here.
This market combines high corn demand with substantial wheat and oilseed acreage. Urea and MAP are especially important in northern dryland systems, while ammonium sulfate can address both nitrogen and sulfur requirements.
Projects must account for weather-related seasonality, winter storage, rail availability and the short planting window. Reliability of delivery may be as important to buyers as the nominal plant-gate price.
The Prairie Gateway generally records lower fertilizer costs per acre than more intensive corn-producing regions. That does not mean demand is small. Extensive wheat, sorghum and cotton acreage creates a large geographic market, but drought and commodity-price conditions can produce significant annual changes in application rates.
Competitive projects need flexible distribution, low transportation costs and the ability to serve customers across long distances.
The South has a diversified crop base and, in some areas, higher fertilizer expenditures per acre. Warm temperatures, heavy rainfall and sandy or weathered soils can increase the importance of split applications, sulfur, potassium and micronutrient management.
This region also contains major ports, river terminals and fertilizer-production infrastructure. Projects should evaluate hurricane exposure, flooding, river conditions and alternative transportation routes because disruptions can affect both feedstock receipts and product deliveries.
Western markets generally purchase less bulk fertilizer than the Corn Belt, but they can support higher-value formulations. Fertigation, drip irrigation, salinity management and crop-specific nutrient programs increase demand for soluble, chloride-sensitive and specialty products.
A project targeting this region should focus on dollars of margin per ton and customer performance requirements rather than total national tonnage alone.
Demand is distributed among dairy farms, feed-crop operations and specialty-crop producers. Smaller delivery lots, seasonal storage and customized blends may be more important than very large commodity shipments.
Projects can compete through localized service, short-haul delivery, blending flexibility and integration with manure- and nutrient-management programs.
Therefore, a serious market study should build regional volume estimates from several sources:
This bottom-up approach is substantially more defensible than applying a national market-growth percentage to an entire multistate region.
Nitrogen has the largest U.S. consumption base and the broadest geographic demand. Ammonia, urea, UAN and ammonium sulfate projects can potentially serve corn, wheat, cotton, rice and specialty-crop markets.
The feasibility challenge is usually not proving that nitrogen is needed. It is proving that the proposed facility can manufacture and deliver nitrogen competitively after accounting for natural gas, electricity, water, carbon dioxide, maintenance, transportation and plant-utilization risk.
Potash offers the clearest import-substitution narrative. Nearly all U.S. potassium chloride requirements are supplied through imports, with Canada acting as the dominant source.
The project challenge is technical and capital intensive. A credible application requires verified mineral resources, demonstrated extraction technology, realistic recovery rates, permitting progress and a transportation plan that can reach major agricultural regions.
The United States has domestic phosphate production, but it is concentrated in a limited number of states. Projects involving phosphate rock, phosphoric acid, MAP, DAP or specialty phosphate products may create value through geographic diversification, modernization or improved access to regional buyers.
The feasibility study should carefully model sulfuric acid, ammonia, phosphate rock, environmental compliance, waste management and delivered-cost competition.
Sulfur deficiencies have become increasingly important in several crop-production systems, supporting demand for ammonium sulfate, ammonium thiosulfate and sulfur-containing blends.
Specialty projects may also target calcium, magnesium, zinc, boron and other nutrients. Although these markets are smaller in tonnage, they may offer higher margins and less direct competition than commodity nitrogen, phosphate or potash.
A strong study should answer seven practical market questions:
USDA’s feasibility guidance requires analysis of economic, market, technical, financial and management feasibility, followed by an independent conclusion on whether the proposed project is practical, viable and likely to succeed.
The U.S. fertilizer market is large, essential and highly regional.
Nationally, nitrogen represents the largest demand category. Potash presents the greatest import dependency. Phosphate benefits from domestic resources but concentrated production geography. Specialty and sulfur products offer smaller but potentially higher-margin opportunities.
For FIELDS applicants, broad statements about national fertilizer demand will not be enough. The strongest applications will identify a specific product, a defined service territory, credible delivered prices, measurable regional volume, committed customers and a realistic path to commercial production.
A well-prepared feasibility study connects those market findings to plant capacity, feedstock availability, logistics, construction costs, financing and financial performance. That connection is what turns a promising fertilizer concept into a project USDA can evaluate as practical, competitive and ready to deliver measurable benefits to American agriculture.
The USDA FIELDS Program supports investments that expand independent domestic fertilizer manufacturing and strengthen the U.S. agricultural supply chain.
Nitrogen fertilizers generally represent the largest demand category, followed by phosphate and potash products.
The United States is highly dependent on imported potash and also imports significant quantities of urea and other nitrogen products.
Prices vary according to nutrient concentration, feedstock costs, production methods, transportation expenses, seasonality and regional availability.
The Corn Belt and Heartland generally have the largest bulk-fertilizer demand because of extensive corn and soybean production.
A feasibility study evaluates market demand, competition, production technology, capital costs, operating expenses, financing and the project’s ability to succeed.

President, Wert-Berater, Inc. — independent feasibility study consultants since 1998. 4,000+ engagements completed across all 50 states and internationally, evaluating $41.2 billion in project value for SBA, USDA, EB-5, conventional, and institutional financing decisions. Fiduciary duty runs to the lender and agency in every engagement.
+1 310-857-2443 ext. 800 · email · 1968 South Coast Hwy, Ste 2382, Laguna Beach, CA 92651 · 111 Town Square Pl Ste 1238 PMB 657834, Jersey City, NJ 07310 · 539 W. Commerce St #8486, Dallas, TX 75208 · 66 W Flagler Street, Suite 900, PMB 12704, Miami, FL 33130
Schedule a ConversationIndependent feasibility studies since 1998 — 4,000+ engagements, $41.2 billion in evaluated project value. FIELDS studies: standard turnaround two weeks; RUSH delivery in 7 business days at additional cost. Fiduciary duty to the lender and agency.
Legal disclosure. Wert-Berater, Inc. offices are mailing addresses only. Following the COVID-19 pandemic the firm has elected to work remotely; its office locations receive mail and are not staffed for visitors or in-person meetings. Headquarters mailing address: 1968 South Coast Hwy, Ste 2382, Laguna Beach, CA 92651.
Wert-Berater, Inc. is an independent provider of feasibility studies and other related services. The firm does not provide financing or equity investment advice, and does not arrange, broker, or place debt or equity capital of any kind.
All appraisal assignments are performed by Bruce E. Jones, MAI, ASA-GC, BCA, CMEA, a member of the Appraisal Institute since 2006, a staff member of Wert-Berater, Inc. and owner of Special Purpose Realty Valuation.