Between the field and the shelf sits the plant — and restoring or building one is the heaviest underwriting lift in rural finance.
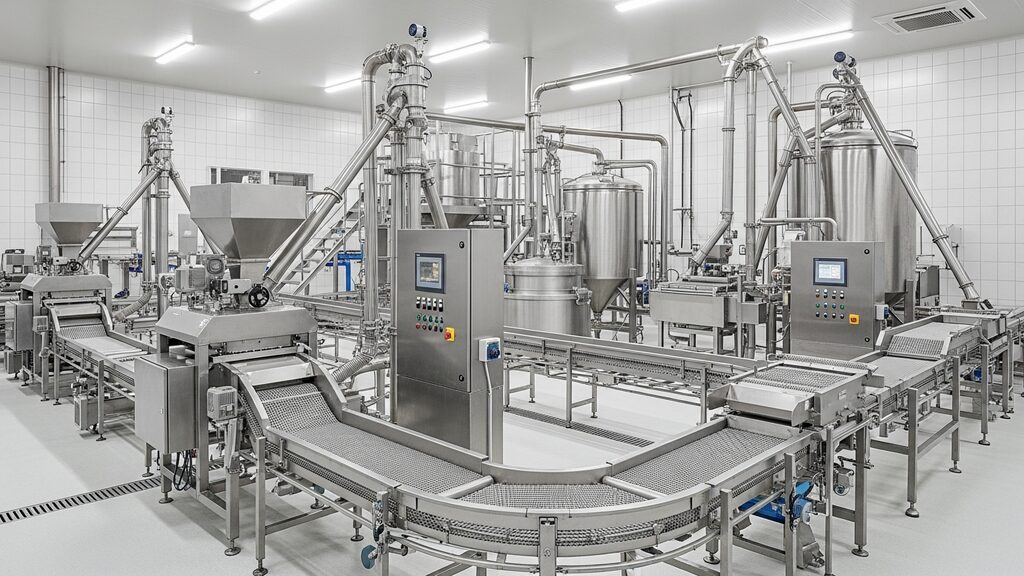
Agricultural processing — milling, crushing, refining, packing — converts commodity throughput into margin, and the credit analysis runs the full supply chain: grower supply within economic haul distance (contracted acres, not regional averages), the plant’s mass-balance and utilization math, and the offtake structure on the finished product. Restoration projects add a layer greenfield builds avoid: the existing asset’s true condition, where rehabilitation scope is the budget’s biggest uncertainty and the technical review’s biggest job.
USDA B&I is the category’s natural financing home, which makes Reg 5001’s factor-by-factor structure the compliance frame: economic placement in the regional ag economy, market access quantified, technical execution evidenced contractor by contractor, and the capital stack — guaranteed debt over sponsor equity — reconciled source to use.
The category’s defining recent engagement: a $38,110,000 capitalization to restore an idle Rio Grande Valley sugar refinery — $25,000,000 of B&I guaranteed debt, $13,110,000 of sponsor equity, 359,000 square feet of processing and cane-yard infrastructure, 2.05 million tons of annual cane capacity, with dual Texas and Gulf-refiner market access carrying the demand case and grower-supply arrangements stated as the conditions they are.
Processing plants apply supply-shed mass-balance methodology — demand analysis runs upstream and downstream simultaneously because the plant’s economics are a conversion spread. Upstream definition: the supply shed is the production acreage within economic haul distance, defined by the crop’s freight tolerance. Application: available feedstock = acres in shed × yield per acre × commitment share, where commitment share counts contracted acres rather than the county’s gross crop; the recent sugar refinery engagement tested 2.05 million tons of cane capacity against exactly this arithmetic for the Rio Grande Valley’s grower base.
The conversion mathematics: finished output = feedstock throughput × recovery rate, with recovery validated against the equipment specification and comparable plants — and the utilization curve applied honestly: effective output = nameplate capacity × utilization by year, ramping over the commissioning seasons heavy processing actually requires. Downstream demand follows offtake analysis: committed revenue = contracted volumes × contract prices, with uncommitted production priced at market and the buyer concentration stated as the counterparty risk it is — the refinery’s dual Texas-and-Gulf market access existed precisely to answer that question. The rationale: mass balance makes the entire revenue line traceable to acres, recovery physics, and signatures — three things an agency reviewer can verify — which is why the 5001 framework’s technical and market factors are satisfied by exactly this arithmetic.
Processing files flag along the supply chain they depend on. Upstream: grower supply described in regional tonnage rather than contracted acres — a refinery’s catchment is the acres committed to it, not the crop the county grows. Midstream: restoration budgets for idle plants built from walkthroughs rather than engineering assessments, where the deferred-maintenance iceberg lives; throughput claims at nameplate capacity from day one with no commissioning ramp; and the labor plan that assumes a rural workforce the town’s population cannot supply. Downstream: offtake concentration in one or two buyers presented without the counterparty analysis their weight demands, and logistics costs — the freight between plant and market — estimated at rates the lanes will not honor.
Mitigation at processing scale is diligence depth. The $38,110,000 sugar refinery engagement is the firm’s template: restoration scope built against the asset’s actual condition, 2.05 million tons of cane capacity tested against the Valley’s real grower base, and dual-market access — Texas demand and Gulf refiners — analyzed so the revenue case did not hang on one buyer. Where supply commitments lag, the determination conditions on executed grower agreements at specified acreage; where the budget’s engineering basis is thin, the condition is the assessment itself, priced and scheduled. Labor reality gets addressed structurally — wage positioning, housing partnerships where the town requires them — because a plant that cannot staff its second shift was never feasible at its modeled throughput.
Contract the supply shed first: committed acres with named growers convert your demand case from geography to pipeline. For idle-plant restorations, buy the engineering assessment before you buy the plant — the gap between walkthrough and reality is the category’s defining loss. Model the commissioning ramp honestly; heavy processing reaches nameplate over seasons, not weeks. Diversify offtake before the lender asks, and underwrite your anchor buyers like the counterparty risks they are. Solve labor early — wages, housing, training partnerships — and put the solution in the file. And use the program architecture: USDA’s rural-processing priority is real, and a study built to the 5001 factor list moves through the agency it was written for.
Policy tailwinds favor the category: federal investment in domestic and regional processing capacity has been sustained across administrations, and rural-development programs continue to prioritize exactly these credits. The reshoring of food-system capacity is structural — processors located against their supply sheds are winning on freight and resilience arguments that the past decade’s disruptions made permanent. The counterweights are labor and energy: rural processing wages have reset upward with everyone else’s, and energy-intensive operations now carry power-cost sensitivity as core analysis. Automation is the sector’s answer, and capital plans that include it are increasingly what credible throughput assumptions look like.
Engagements are typically initiated by the borrower, with lender or CDC confirmation obtained before work begins — institutions apply differing rules, so sponsors should confirm the required path with their lending contact — and are delivered in 10 to 15 business days from complete project data, and built to the program framework that governs the credit — SBA SOP 50 10 8 coverage minimums of 1.15x operating and 1.00x global, the 37-factor structure of USDA RD Instruction 5001, or the 1.20x convention of conventional credit policy — with a ten-year pro forma, sensitivity at ±5/10/15 percent, rate stress to +3.0 percent, and Monte Carlo analysis as standard equipment.

President, Wert-Berater, Inc. — independent feasibility study consultants since 1998. More than 4,000 feasibility studies completed across all 50 states and internationally, evaluating $40.2 billion in project value for SBA, USDA, EB-5, conventional, and institutional financing decisions. Fiduciary duty runs to the lender and agency in every engagement.
+1 310-857-2443 ext. 800 · email · 1968 South Coast Hwy, Ste 2382, Laguna Beach, CA 92651 · 111 Town Square Pl Ste 1238 PMB 657834, Jersey City, NJ 07310 · 539 W. Commerce St #8486, Dallas, TX 75208
Schedule a ConversationIndependent feasibility studies since 1998 — 4,000+ engagements, $40.2 billion in evaluated project value. Standard delivery in 10 to 15 business days. Fiduciary duty to the lender and agency.