
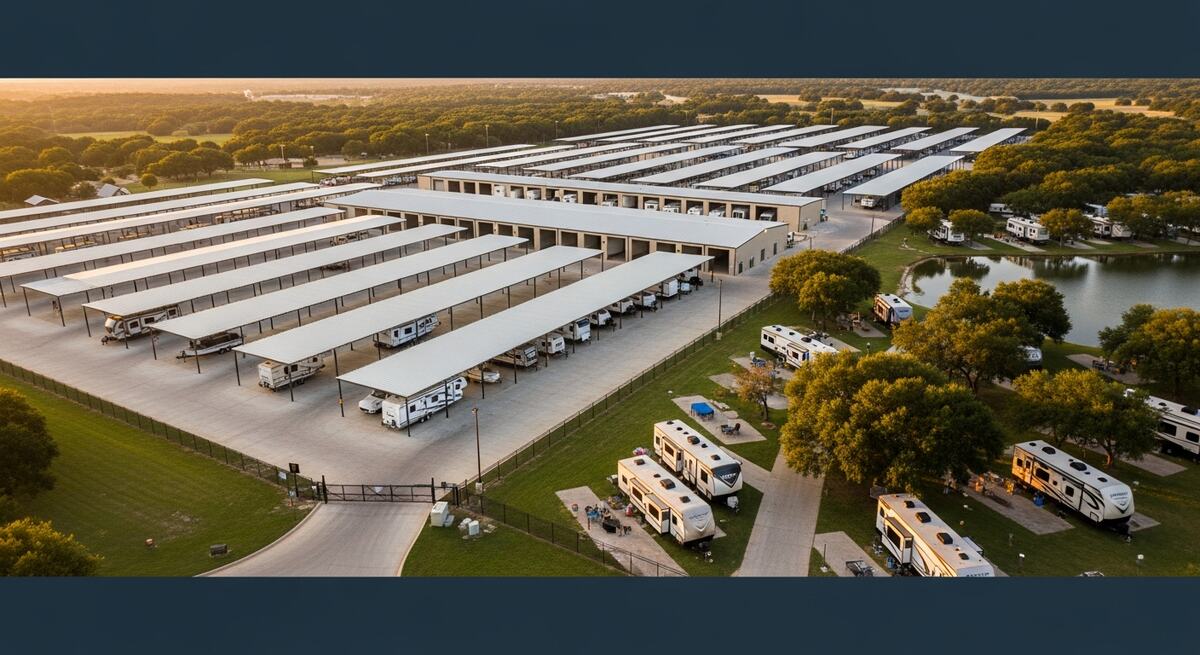
The two best opportunities are related but very different. RV and boat storage is a real-estate / storage-income play; RV park development is an outdoor-hospitality / workforce-lodging play. The strongest Texas strategy is often a phased hybrid — storage as the stable income base, RV sites and cabins as the higher-yield layer.
Each calls for a different study. Land-based RV, trailer and boat parking is analyzed on drive-time trade area and storage lease-up economics under RV and boat storage feasibility studies. Overnight RV sites with hookups and amenities are an outdoor-hospitality credit analyzed under RV resort and campground feasibility studies. Coastal and lake projects placing vessels in racks or slips are analyzed against registered-vessel demand under a marina feasibility study.
Firm-wide engagement figures are distinct from project-specific findings and their stated source periods.
Texas has sustained demand because it combines population growth, RV travel, boating culture, lakes, coastal recreation, suburban HOA restrictions, high vehicle ownership, winter visitors, construction labor, energy-sector workers, and outdoor tourism.
Public / industry estimates may become outdated, but the demand backdrop is strong. Texas reached about 31.7 million people in July 2025, added more than 391,000 residents from 2024 to 2025, and remained the national leader in numeric population growth. That growth is concentrated in the Texas Triangle — Dallas–Fort Worth, Austin, San Antonio, and Houston — which is exactly where storage and RV-travel demand are strongest.
Texas is also a major boating state. Texas Parks & Wildlife (TPWD) reported nearly 560,000 registered recreational boats and an estimated 359,000 unregistered vessels such as kayaks, paddleboards, and small sailboats, alongside roughly 1.7 million surface acres of freshwater inland lakes, 4 million surface acres of saltwater, and major river and stream resources. On the RV side, the national market is softer than the pandemic boom but not broken: RVIA reported a 2026 shipment forecast midpoint of 314,000 RVs, down from about 342,200 units the prior year, citing tighter household budgets and higher financing costs, while noting that long-term ownership and travel fundamentals remain strong. KOA’s 2026 Camping & Outdoor Hospitality Report says more than 52 million North American households camped in 2025, generating a $66 billion economic footprint, and the BEA reported outdoor recreation accounted for $696.7 billion, or 2.4% of U.S. GDP, in 2024, with Texas among the largest state contributors.
Bottom line: RV/boat storage is the more stable and bankable first move. RV parks can produce higher upside, but they are more operationally complex and more sensitive to seasonality, labor, utilities, guest experience, reviews, and local regulation.
| Factor | RV / boat storage | RV park development |
|---|---|---|
| Business model | Monthly rental storage | Nightly, weekly, monthly hospitality lodging |
| Revenue stability | High once leased | Medium to high, depending on long-term guests |
| Operating intensity | Low to moderate | Moderate to high |
| Staffing | Lean | Requires guest service, maintenance, reservations |
| Utilities | Moderate | Heavy: water, sewer / septic, electric, Wi-Fi |
| Zoning risk | Moderate | Moderate to high |
| Construction risk | Moderate | High if utilities / septic / pads / amenities are complex |
| Lender view | More like self-storage / special-use CRE | More like hospitality / campground |
| Best use | Suburban / lake / coastal storage demand | Tourism, workforce, winter Texans, long-term stays |
| Biggest risk | Overpaying for land or overbuilding enclosed units | Becoming an under-amenitized, under-managed park |
Our recommendation: for most Texas developers, start with RV/boat storage unless the site has clear tourism, workforce, or long-term RV-living demand. If the site has both, use storage as the income anchor and add RV sites in phases.
The strongest storage demand comes from six forces: HOA and deed restrictions (many Texas subdivisions limit visible RV, boat, trailer, and commercial-vehicle parking, creating off-site demand); smaller suburban lots (new master-planned communities have shorter driveways and garages that cannot handle 30–45-foot RVs, pontoons, wake boats, and trailers); high boat and RV asset values (owners pay for covered or enclosed storage to avoid sun, hail, theft, vandalism, battery drain, and tire damage); lake and coastal proximity (demand spikes within 10–30 minutes of major lakes, marinas, boat ramps, and coastal launch points); high-income suburban growth (affluent households own more RVs, boats, trailers, side-by-sides, and jet skis); and commercial overflow (contractors, food trucks, landscapers, and tradespeople need secure trailer and vehicle parking).
RV park demand is strongest when at least two or three demand sources overlap.
| Demand source | Why it matters |
|---|---|
| Tourism / recreation | Supports nightly and weekly rates |
| Lake / river / coast | Supports weekends, boating, fishing, family travel |
| Winter Texans | Supports long monthly stays in coastal and South Texas markets |
| Workforce housing | Supports stable monthly occupancy |
| Construction projects | Supports temporary long-term demand |
| Energy / industrial corridors | Supports recurring worker lodging |
| Medical / travel nurses | Supports monthly or extended-stay demand |
| Retirees / full-time RVers | Supports long-term occupancy |
| Events | Supports peak weekends, rallies, festivals, rodeos, tournaments |
| High housing costs | Makes RV living a substitute housing option |
Texas tourism gives RV parks a tailwind: Travel Texas reported 62 million travelers, $97.5 billion in visitor spending, and a total economic impact of about $199.5 billion in 2024.
| Rank | Market | Why demand is strong | Best product |
|---|---|---|---|
| 1 | North DFW: Celina, Prosper, McKinney, Anna, Melissa, Aubrey, Denton, Pilot Point | Explosive population growth, high-income households, HOA restrictions, proximity to Ray Roberts, Lewisville, Lavon, Texoma | Class-A covered + enclosed storage |
| 2 | Lake Conroe / Montgomery / Magnolia / Tomball / The Woodlands | Boat ownership, affluent suburbs, Lake Conroe, HOA-heavy communities, North Houston growth | Covered / enclosed RV + boat storage, dump station, wash bay |
| 3 | Georgetown / Liberty Hill / Leander / Lago Vista / Lake Travis / Burnet / Marble Falls | Austin growth, Hill Country recreation, high-income households, lake access | Premium enclosed and canopy storage |
| 4 | Canyon Lake / New Braunfels / Bulverde / Spring Branch / Seguin | Lake, river, tourism, San Antonio / Austin draw, RV and boat activity | Storage + RV park hybrid |
| 5 | Granbury / Weatherford / Aledo / Cresson / Eagle Mountain Lake | DFW weekend recreation, lake homes, RV ownership, western growth | Covered storage and premium open spaces |
| 6 | Katy / Fulshear / Cypress / Hockley / Waller | Suburban growth, master-planned communities, trailers / RVs, high income | RV / trailer storage, covered spaces |
| 7 | Corpus Christi / Rockport / Aransas Pass / Port Aransas | Coastal boating, fishing, winter Texans, high boat ownership | Hurricane-resilient boat storage, covered / enclosed |
| 8 | Freeport / Lake Jackson / Matagorda / Palacios | Fishing / coastal boating, industrial workforce | Boat storage + monthly RV sites |
| 9 | Tyler / Longview / Lake Palestine / Lake Fork / Cedar Creek Lake | Lake homes, fishing, lower land basis | Value covered / open storage |
| 10 | Midland / Odessa / Pecos / Monahans | Workforce vehicles, RVs, trailers, energy-sector demand | RV / trailer storage, open / covered, possible worker RV sites |
| Rank | Market | Best RV park concept |
|---|---|---|
| 1 | New Braunfels / Canyon Lake / Guadalupe River / Seguin | Hybrid destination + monthly park with river / lake access, cabins, family amenities |
| 2 | Lake Conroe / Montgomery / Willis / Huntsville | Lake-oriented RV resort with storage, boat parking, long-term sites |
| 3 | Hill Country: Fredericksburg, Kerrville, Blanco, Burnet, Marble Falls, Llano | Destination RV resort, cabins, glamping, wine / tourism, 55+ seasonal stays |
| 4 | Port Aransas / Rockport / Corpus / Aransas Pass | Coastal RV resort, winter Texans, boat parking, storm-resilient infrastructure |
| 5 | Granbury / Lake Whitney / Possum Kingdom / Texoma | Lake and weekend-leisure RV park with boat storage |
| 6 | Permian Basin: Midland, Odessa, Pecos | Workforce monthly RV park with durable utility infrastructure |
| 7 | Gulf Coast industrial: Freeport, Baytown, Beaumont, Port Arthur | Worker RV park with metered electric, laundry, security |
| 8 | Big Bend / Alpine / Marathon / Terlingua | Destination outdoor hospitality, glamping + RV, but seasonal and remote |
| 9 | East Texas lakes: Livingston, Palestine, Fork, Sam Rayburn, Toledo Bend | Value RV park + fishing / boat storage |
| 10 | I-35 / I-10 / I-20 interstate nodes | Overnight / transient park only if visibility, access, and rates support it |
For most Texas growth markets, the best first project is a Class-A RV and boat storage facility on 5–15 acres.
| Product | Share of units | Why |
|---|---|---|
| Open outdoor spaces | 10%–25% | Lowest cost, good for trailers and price-sensitive customers |
| Covered canopy spaces | 45%–60% | Best balance of cost, rent premium, and demand |
| Fully enclosed units | 20%–35% | Highest rent, strongest for expensive RVs / boats, but capex-heavy |
| Oversized pull-through spaces | 10%–20% | High value for large Class-A motorhomes and fifth wheels |
| Contractor / trailer parking | 5%–15% | Useful in growth corridors if allowed by zoning |
Recommended features: 24/7 gated access, keypad or app-based entry, wide drive aisles, pull-through canopy units where possible, 12–14-foot-wide spaces, 35–60-foot depth options, 14-foot doors for enclosed units, 110V trickle charging (not full live-aboard power), LED lighting, HD cameras, perimeter fencing, license-plate cameras if budget allows, a dump station, potable water, a wash bay or wash pad, online rental and payment, a small office or kiosk, and correctly engineered stormwater / drainage.
The strongest format depends on the demand source. A workforce RV park (Permian Basin, Gulf Coast industrial, data-center / construction corridors) should be 80–150 full-hookup sites with 30/50-amp metered electric, water / sewer, laundry, showers, strong Wi-Fi or cellular, gravel or concrete pads, quiet-hours rules, cameras, and monthly leases — and should not overbuild pools or clubhouses unless leisure demand also exists. A destination RV resort (Hill Country, Lake Conroe, Canyon Lake, New Braunfels, coast, Granbury, Texoma, Port Aransas / Rockport) runs 100–250 sites with large premium pull-throughs, full hookups, a pool, clubhouse, laundry, camp store, dog park, playground, pickleball or activity court, bathhouse, pavilion, cabins or glamping, online booking, dynamic pricing, and event programming. A hybrid park + storage (Lake Conroe, Canyon Lake, Granbury, Texoma, Corpus / Rockport, East Texas lakes) pairs 60–120 RV sites with 150–400 storage spaces plus covered / enclosed boat / RV storage, a dump station, wash bay, store / office, laundry, and boat-trailer parking — often the best risk-adjusted model because storage stabilizes income while RV sites capture upside.
Public construction estimates vary widely by land, paving, drainage, structure type, steel pricing, and utilities. One RV-storage construction guide estimates simple outdoor asphalt / fenced storage at roughly $10–$15 per square foot, steel-canopy structures at roughly $30–$50 per square foot, fully enclosed units at $60–$100+ per square foot, and site development at another $4.25–$8 per square foot beyond basic construction — and cites total project costs of roughly $2M–$5M for a 3-acre facility including land, depending heavily on site and scope.
| Facility type | Typical land | Development cost (excl. land) | Total project range (with land) |
|---|---|---|---|
| Basic open RV / boat storage | 3–8 acres | $500K–$2.5M | $1M–$5M |
| Open + covered storage | 5–12 acres | $2M–$8M | $3M–$12M |
| Class-A covered + enclosed | 7–20 acres | $5M–$18M | $7M–$25M+ |
| Luxury enclosed condominium-style storage | 5–15 acres | $8M–$25M+ | $10M–$35M+ |
The biggest cost variables are land price, detention / stormwater, paving type (gravel, asphalt, concrete), steel-canopy cost, enclosed-unit percentage, power to units, gate / security systems, drainage, floodplain mitigation, fire access, landscaping / screening requirements, and permitting and off-site utility extensions.
RV park costs are usually driven by utilities. A public RV-park development guide estimates land can range from roughly $1,000 to $100,000+ per acre, and development costs per RV pad can run about $15,000–$50,000 per site for grading, roads, and utility hookups, before higher-end amenities and difficult site conditions.
| RV park type | Typical scale | Development cost (excl. land) | Total project range (with land) |
|---|---|---|---|
| Small rural monthly park | 25–60 sites | $750K–$3M | $1M–$5M |
| Workforce RV park | 80–150 sites | $3M–$9M | $4M–$12M |
| Standard family RV park | 80–150 sites | $5M–$15M | $7M–$20M |
| Destination RV resort | 150–300 sites | $12M–$40M+ | $15M–$60M+ |
| RV resort + cabins / glamping | 100–250 sites + cabins | $15M–$50M+ | $20M–$75M+ |
| Site type | Cost per site |
|---|---|
| Gravel full-hookup site | $20K–$45K |
| Concrete full-hookup site | $35K–$75K |
| Premium pull-through resort site | $50K–$100K+ |
| Coastal or flood-resilient site | $75K–$150K+ |
| Cabin / glamping key | $75K–$250K+ |
The single biggest mistake in RV park underwriting is assuming “land + gravel pads” is enough. In Texas, the real feasibility question is often water, sewer / septic, electric capacity, drainage, detention, transformer timing, and floodplain.
Public rate data is fragmented because many facilities hide pricing until a customer selects inventory. The category has been improving: Yardi Matrix reported RV and boat storage parking rents rose 4.4% year over year in September 2025 — the strongest rent growth since it began tracking the sector — although rent growth was weakest in Sun Belt markets with heavy recent development.
| Storage type | Monthly rate range | Strong-market rate |
|---|---|---|
| Open outdoor 10x30 / 12x35 | $75–$150 | $125–$200 |
| Open oversized 12x45 / 12x60 | $125–$225 | $175–$300 |
| Covered canopy | $150–$350 | $250–$450 |
| Enclosed 12x35 / 14x40 | $250–$500 | $400–$650 |
| Enclosed 14x50 / 14x60 | $400–$750 | $600–$900+ |
| Premium enclosed with power | $500–$900+ | $750–$1,200+ |
Consider a 7–10-acre Class-A storage project:
| Unit type | Units | Monthly rate | Stabilized occupancy | Annual revenue |
|---|---|---|---|---|
| Open spaces | 80 | $125 | 90% | $108,000 |
| Covered spaces | 140 | $225 | 90% | $340,200 |
| Enclosed units | 60 | $475 | 90% | $307,800 |
| Admin / late fees / misc. | — | — | — | $20K–$40K |
| Total gross revenue | 280 spaces | — | — | ~$776K–$796K |
Well-run storage assets typically run operating expenses of 30%–40% of effective gross income, depending on taxes, insurance, staffing, security, maintenance, and software — implying rough NOI of $465K–$555K in this example.
| Total project cost | NOI | Yield on cost |
|---|---|---|
| $5.5M | $500K | ~9.1% |
| $6.5M | $500K | ~7.7% |
| $8.0M | $500K | ~6.3% |
| $10.0M | $500K | ~5.0% |
Feasibility takeaway: RV/boat storage can be excellent, but only if land basis and construction cost are controlled. If land is too expensive or too much enclosed product is built before demand is proven, the yield compresses quickly. See our note on capture-rate analysis — the number that decides whether the rates above are real for your trade area.
Texas RV park rates vary dramatically by region, quality, season, and length of stay. One Texas RV park rate page shows daily rates of $70–$90, weekly rates of $350–$385 plus electric, and monthly rates from $720 to $1,065 plus electric, depending on site tier. Another Texas monthly-rate guide summarizes broad pricing as about $450–$650 per month in smaller towns and I-20-corridor markets, $600–$900 in mid-sized / workforce regions, and $800–$1,200 in major metros, with coastal and Hill Country markets varying seasonally.
| RV park type | Daily | Weekly | Monthly |
|---|---|---|---|
| Rural value park | $35–$55 | $225–$325 | $450–$650 |
| Workforce monthly park | $45–$75 | $275–$425 | $600–$950 |
| Metro-area full-hookup park | $60–$95 | $350–$550 | $800–$1,200 |
| Lake / Hill Country resort | $75–$150+ | $450–$900 | $850–$1,500+ |
| Coastal winter-Texan park | $60–$125 | $400–$800 | $700–$1,400+ seasonal |
Consider a hybrid 120-site park: 60 monthly sites at $775/month (85% occupancy), 50 transient sites at $75 ADR (42% annual occupancy), 10 premium sites / cabins at $140 ADR (38% occupancy), and ancillary revenue equal to 10% of site revenue.
| Revenue source | Annual revenue |
|---|---|
| Monthly RV sites | ~$474K |
| Transient RV sites | ~$575K |
| Premium sites / cabins | ~$194K |
| Ancillary revenue | ~$124K |
| Total gross revenue | ~$1.37M |
A simple monthly park may operate at a 35%–45% expense ratio if electric is metered and staffing is lean; a resort-style park may run 45%–60% because of labor, pool, activities, landscaping, booking systems, repairs, card fees, supplies, and guest service.
| Expense ratio | NOI |
|---|---|
| 40% | ~$822K |
| 50% | ~$685K |
| 60% | ~$548K |
| Total project cost | NOI at 50% expense ratio | Yield on cost |
|---|---|---|
| $7M | $685K | ~9.8% |
| $10M | $685K | ~6.9% |
| $12M | $685K | ~5.7% |
| $15M | $685K | ~4.6% |
Feasibility takeaway: RV parks can produce attractive returns, but utilities, amenities, and site work can easily push cost beyond what the local rates support.
| Amenity | Cost | Revenue / value impact | Payback view |
|---|---|---|---|
| Gated access, cameras, lighting | Moderate | Required for Class-A positioning | Mandatory, not optional |
| Wide aisles / pull-through layout | Design cost | Reduces damage, improves leasing | High value |
| Covered canopy | High | Major rent premium vs. open | Good in hail / sun markets |
| Fully enclosed units | Very high | Highest rent, strongest for expensive assets | Good only where income supports it |
| 110V trickle power | Low to moderate | Rent premium and retention | Usually excellent |
| Full 30/50-amp power | High | Can create live-aboard risk | Avoid unless controlled |
| Dump station | Moderate | Retention, differentiation | Strong for RV customers |
| Potable water | Low to moderate | Useful with dump station / wash pad | Good |
| Wash bay / wash pad | Moderate to high | Fee revenue + convenience | Good if drainage / permitting works |
| Mobile detail partnerships | Low | Ancillary revenue | Good |
| Propane | Moderate | Useful near RV park / lake | Good if volume exists |
| Climate control | Very high | Niche only | Usually not needed |
| On-site manager apartment | High | Security / ops | Useful for large sites |
Best storage amenity package: gate, cameras, lighting, covered spaces, some enclosed spaces, trickle power, dump station, potable water, wide aisles, and online rental. That is the Class-A baseline.
| Amenity | Cost | Best fit | Payback view |
|---|---|---|---|
| Full hookups | High | All RV parks | Mandatory |
| Metered electric | Moderate | Monthly / workforce parks | Essential in Texas |
| Strong Wi-Fi / cell solution | Moderate | All parks, especially monthly | High retention value |
| Laundry | Moderate | Monthly / workforce / winter Texan | Strong direct and indirect payback |
| Dog park | Low | All parks | High perceived value |
| Bathhouse | Moderate to high | Transient / resort parks | Required for quality |
| Clubhouse | High | Winter Texans, 55+, resort | Good if programmed |
| Pool | High | Resort / family / coastal / Hill Country | Only if ADR supports it |
| Pickleball | Moderate | 55+, resort, winter Texans | Good perceived value |
| Playground | Low to moderate | Family destination | Good |
| Camp store | Moderate | Resort / transient | Good if high traffic |
| Cabins / glamping | High | Tourism markets | Strong if demand exists |
| Pavilion / event lawn | Moderate | Groups, rallies, family parks | Good if booked |
| Boat ramp / marina | Very high | Lake / coast | Only with serious demand and permitting |
Amenities that usually pay back fastest: laundry, dog park, Wi-Fi, metered electric, premium pull-through sites, online booking, shade, and clean bathhouses. Amenities that can hurt returns: oversized pools, restaurants, large clubhouses, man-made lakes, too many cabins before demand is proven, and anything that raises payroll without raising rates.
1. Tomball / Magnolia / Montgomery / Lake Conroe storage. One of the best North Houston storage plays — Lake Conroe, The Woodlands-area income, Tomball / Magnolia growth, HOA restrictions, contractor demand, and large recreational ownership. Best build: a 7–15-acre covered / enclosed facility with dump station, water, wash bay, security, and oversized pull-through canopy units. A pure RV park needs a clear demand driver (lake access, festival proximity, event overflow, worker demand); otherwise storage is safer.
2. Georgetown / Liberty Hill / Leander / Burnet / Marble Falls. Austin growth, Hill Country income, Lake Travis / Buchanan / Inks recreation, and master-planned communities. Best build: premium enclosed and covered storage; add RV sites only with a scenic / tourism angle or lake driver.
3. New Braunfels / Canyon Lake / Bulverde / Seguin. One of the best hybrid markets in Texas — river demand, lake demand, Austin / San Antonio weekend traffic, wedding / event demand, and retiree travel. Best build: an RV resort or hybrid park with 80–150 sites, family amenities, cabins / glamping, and boat / RV storage.
4. North DFW / Denton / Celina / Prosper / Aubrey / Pilot Point. A top-tier storage market. Best build: Class-A RV / boat / trailer storage with a high share of covered and premium enclosed units. RV parks are harder in dense suburban zoning but can work near Lake Ray Roberts, Texoma, or rural-edge parcels.
5. Granbury / Weatherford / Aledo / Eagle Mountain / Cresson. Strong storage and RV market combining DFW weekend recreation, western growth, lake activity, and RV ownership. Best build: covered / enclosed storage plus a smaller RV park if the site has lake access, highway visibility, or destination appeal.
6. Rockport / Aransas Pass / Corpus / Port Aransas. A strong coastal boat and RV market that requires hurricane, windstorm, flood, and insurance discipline. Best build: storm-resilient boat storage, RV storage, and coastal RV sites. Avoid underbuilt coastal structures, low elevation, weak drainage, and assuming winter-Texan demand alone supports luxury capex.
7. Permian Basin / Midland / Odessa / Pecos. More workforce than recreation. Best build: a monthly RV park, RV / trailer storage, laundry, security, metered electric, and durable utilities. Avoid overbuilding resort amenities or underwriting only the current oil cycle.
| Loan type | Best use |
|---|---|
| Conventional CRE loan | Stabilized or well-supported storage development |
| Construction loan | Ground-up storage with strong equity and a feasibility study |
| SBA 504 | Possible only if the project qualifies as an active operating business and is not passive rental real estate |
| SBA 7(a) | Potentially useful for operating-business acquisition / working capital, subject to eligibility |
| Seller financing | Existing storage acquisition |
| Private debt / equity | Higher leverage or pre-stabilized projects |
| Local bank loan | Best for smaller rural / suburban storage projects |
Be careful with SBA eligibility: 504 financing can fund major fixed assets, but SBA states loans cannot be made to businesses engaged in passive or speculative activities, and 504 proceeds cannot be used for investment in rental real estate. For pure self-storage or passive storage income, lender interpretation and business structure matter. See our DSCR requirements compared and conventional-lender feasibility guides.
RV parks are more often financeable through SBA, USDA, conventional, or seller financing because they are active hospitality businesses.
Because the park is underwritten as an operating business rather than as leased space, lenders generally require an independent RV park feasibility study consultant to test occupancy, rate and debt-service coverage before the credit is approved.
| Loan type | Best use |
|---|---|
| SBA 7(a) | Acquisition, expansion, working capital, startup support |
| SBA 504 | Owner-operated fixed assets, land, buildings, infrastructure |
| USDA B&I | Rural RV parks and outdoor-hospitality businesses |
| Conventional bank | Stabilized parks with strong DSCR |
| Seller financing | Mom-and-pop park acquisitions |
| Bridge loan | Repositioning or expansion |
| Private equity / JV | Larger RV resort projects |
SBA 504 provides long-term fixed-rate financing for major fixed assets and can fund purchase or construction of land, buildings, utilities, parking lots, and modernization, subject to eligibility. USDA B&I is especially useful for rural RV park, campground, and storage-adjacent projects: USDA says eligible rural areas are generally places outside cities or towns over 50,000 population, and for FY2026 lists guarantees of 85% for applications under $5 million and 80% for applications of $5 million or more, with loan terms not exceeding 40 years. See our SBA 504, SBA 7(a), and USDA B&I feasibility guides.
A storage project is feasible when stabilized occupancy can reasonably reach 85%–95%; land cost does not consume the yield; at least 30%–50% of demand is for covered / enclosed product; competitors have waitlists or limited premium inventory; rate assumptions are based on actual storage competitors (not standard mini-storage); drive aisles and turning radii work for large vehicles; drainage and paving are properly engineered; the facility can support expansion; and the project reaches at least a 7%–9% stabilized yield on cost, depending on debt cost and risk.
A market is approaching saturation when facilities offer multiple free months, covered / enclosed units sit vacant, street rates fall despite population growth, competitors discount Class-A storage, new supply is clustered within 3–5 miles, and open-storage occupancy drops below 75%–80%.
An RV park is feasible when monthly sites can stabilize at 75%–90% occupancy; transient sites can achieve realistic annual occupancy by season; ADR and monthly rates are supported by local competitors; electric is separately metered for monthly guests; utility capacity is confirmed before land closing; the project can cover debt service at conservative occupancy; the park has at least two demand drivers; guest experience and reviews can support repeat visitation; and stabilized DSCR reaches lender requirements, often 1.20x–1.35x+.
An RV park market is becoming saturated when parks discount monthly rates heavily, winter-Texan sites are available in peak season, transient weekends no longer sell out, new parks compete on free rent rather than quality, electric costs go unrecovered, occupancy relies on one temporary construction project, reviews show weak maintenance, or capex rises faster than achievable ADR.
| Pitfall | Why it hurts |
|---|---|
| Using cheap land in the wrong location | Storage is convenience-driven; too far from homes / lakes kills demand |
| Underbuilding drive aisles | Large RVs need turning room; bad design causes damage and churn |
| Too many open spaces | Open storage is easiest to compete against |
| Too many enclosed units too soon | Highest capex; lease-up risk if rates are too high |
| Ignoring stormwater | Texas drainage can destroy a site plan and budget |
| Offering full power | Can invite illegal occupancy or high utility usage |
| Weak security | Premium customers expect high security |
| No online rental | Modern storage customers expect frictionless leasing |
| Pricing like mini-storage | RV / boat storage has different unit economics |
| Ignoring nearby planned supply | New Class-A facilities can crush rent growth |
| Pitfall | Why it hurts |
|---|---|
| Buying land before utility confirmation | Sewer, septic, water, and power can make or break the project |
| Including electric in monthly rent | Texas summer usage can destroy margins |
| Building resort amenities for workforce guests | The wrong amenity package lowers returns |
| Depending on one construction project | Demand can disappear when the project ends |
| No clear guest rules | Park can drift into distressed long-term housing |
| Bad roads and tight sites | Poor reviews and damage claims |
| Underestimating maintenance | Utilities, roads, laundry, bathhouses, and pools need reserves |
| Poor Wi-Fi / cell service | Kills monthly and remote-work demand |
| No dynamic pricing | Leaves revenue on the table in peak periods |
| No legal structure for long-term guests | Tenant / lodger issues can become costly |
Best storage deal: 7–12 acres near a high-growth suburb or lake, with 250–400 spaces, 50%+ covered / enclosed, strong security, dump station, and expansion room. Target underwriting: 85%–95% stabilized occupancy, a 30%–40% expense ratio, 7%–9%+ yield on cost, DSCR 1.25x+, 10%–20% expansion land, minimal staffing, and online leasing.
Best RV park deal: 80–150 sites with full hookups, metered electric, laundry, Wi-Fi, and a clear long-term demand source. Target underwriting: monthly occupancy 75%–90%, transient annual occupancy 35%–55%, a 40%–55% expense ratio, DSCR 1.25x+, utility capacity confirmed before closing, a 10%+ working-capital reserve, and the ability to phase amenities.
Best hybrid deal: 10–30 acres near a lake, coast, or growth suburb with both storage and RV sites — an ideal mix of 200–400 storage spaces, 60–120 RV sites, and 10–20 premium cabins / glamping units only after demand proof, with dump / water / wash and office / laundry / bathhouse shared across both lines, plus expansion land. This is often the strongest long-term wealth-creation model: stable monthly storage income, RV park upside, shared infrastructure, customer cross-sell, land appreciation, and multiple exit strategies.
| Priority | Market | Best project |
|---|---|---|
| 1 | Tomball / Magnolia / Lake Conroe | Premium RV / boat storage; optional small RV phase |
| 2 | Georgetown / Liberty Hill / Burnet / Marble Falls | Covered / enclosed storage; boutique RV resort only near recreation |
| 3 | New Braunfels / Canyon Lake / Seguin | RV resort + boat / RV storage hybrid |
| 4 | North DFW / Denton / Celina / Prosper | Class-A RV / boat storage |
| 5 | Granbury / Weatherford / Eagle Mountain | Storage + weekend RV park |
| 6 | Rockport / Aransas Pass / Corpus | Boat storage + coastal RV resort, storm-resilient |
| 7 | Midland / Odessa / Pecos | Workforce RV park + trailer / RV storage |
| 8 | Freeport / Baytown / Beaumont / Port Arthur | Industrial worker RV park + storage |
| 9 | Tyler / Longview / East Texas lakes | Value storage + fishing-oriented RV park |
| 10 | Big Bend / Alpine / Marathon | Destination RV / glamping, high seasonality |
Bottom-line recommendation: for Texas, the best risk-adjusted opportunity is RV and boat storage near high-growth suburbs, lakes, and HOA-heavy master-planned communities — more stable, easier to operate, and more lender-friendly than a ground-up RV park. The best upside opportunity is a hybrid RV park + RV/boat storage project near a lake, river, coast, Hill Country tourism node, or workforce corridor: storage gives durable income, RV sites create hospitality upside, and cabins / glamping can be added after demand is proven.
The strongest first move is to build 250–400 RV/boat storage spaces on 7–15 acres with 50%+ covered / enclosed product, strong security, a dump station, water, a wash pad, online leasing, and expansion land — then add RV sites only if the site has proven tourism, lake, coastal, or workforce demand. Before land closing: pick the market first (lake / coast storage, suburban HOA storage, workforce RV park, destination RV resort, or hybrid); collect competitor rates within 5, 10, and 20 miles; confirm zoning, floodplain, drainage, water, sewer / septic, and electric capacity; and underwrite storage and RV park revenue separately.

President, Wert-Berater, Inc. — independent feasibility study consultants since 1998. 4,000+ engagements completed across all 50 states and internationally, evaluating $43.8 billion in project value for SBA, USDA, EB-5, conventional, and institutional financing decisions. Fiduciary duty runs to the lender and agency in every engagement.
+1 310-857-2443 ext. 800 · email · 1968 South Coast Hwy, Ste 2382, Laguna Beach, CA 92651 · 111 Town Square Pl Ste 1238 PMB 657834, Jersey City, NJ 07310 · 539 W. Commerce St #8486, Dallas, TX 75208 · 66 W Flagler Street, Suite 900, PMB 12704, Miami, FL 33130
Schedule a ConversationIndependent feasibility studies since 1998 — 4,000+ engagements, $43.8 billion in evaluated project value. Standard delivery in 10 to 15 business days. Fiduciary duty to the lender and agency.
Legal disclosure. Wert-Berater, Inc. offices are mailing addresses only. Following the COVID-19 pandemic the firm has elected to work remotely; its office locations receive mail and are not staffed for visitors or in-person meetings. Headquarters mailing address: 1968 South Coast Hwy, Ste 2382, Laguna Beach, CA 92651.
Wert-Berater, Inc. is an independent provider of feasibility studies and other related services. The firm does not provide financing or equity investment advice, and does not arrange, broker, or place debt or equity capital of any kind.
All appraisal assignments are performed by Bruce E. Jones, MAI, ASA-GC, BCA, CMEA, a member of the Appraisal Institute since 2006, a staff member of Wert-Berater, Inc. and owner of Special Purpose Realty Valuation.
Thousands of real estate, business, and machinery appraisal and litigation assignments.