Assisted Living Facility Feasibility Study Consultants, Wert-Berater, Inc. Executive Snapshot: 2025 Demand & Supply Signals Occupancy & Supply: Senior housing occupancy in the 31 NIC MAP primary markets…
Assisted Living Facility Feasibility Study Consultants, Wert-Berater, Inc. Executive Snapshot: 2025 Demand & Supply Signals Occupancy & Supply: Senior housing occupancy in the 31 NIC MAP primary markets climbed to 88.1% in Q2 2025 , while annual inventory growth fell below 1% (0.97%) , the lowest since tracking began—clear evidence of tight supply and strong absorption. National Investment Center
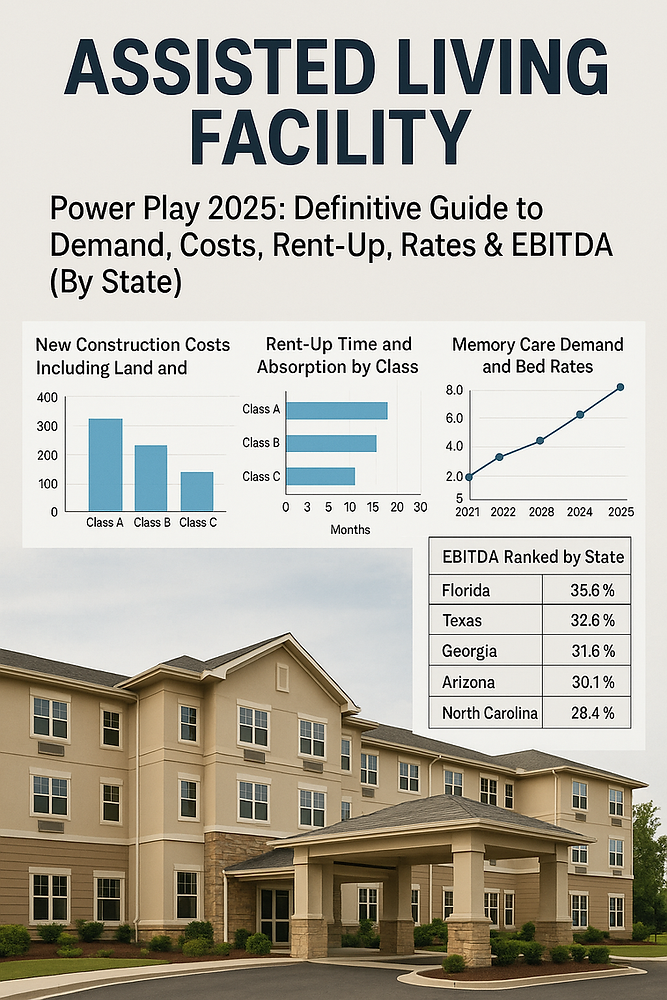
Costs & Pricing: The national median assisted living monthly rate reached $5,900 in 2024 , up ~10% YoY , according to Genworth/CareScout’s Cost of Care Survey. Memory care medians nationally commonly sit higher; recent trackers show national memory care medians in the $6,100–$7,300/month range. Carescout
Construction: Benchmark studies show seniors housing hard costs in the mid-
Why the squeeze? Baby-boomer aging (80+ cohort) is accelerating while new starts remain muted. NIC notes record-low construction starts through 2024–2025; multiple sources expect demand to outstrip new supply for the next several years. National Investment Center, MarketWatch
Rule of thumb (2025): Total development budget per assisted living unit (Class B/A-): $325k–$450k in most Sun Belt/Heartland metros; $450k–$650k (or higher) in constrained coastal markets, inclusive of land, softs, and FF&E—assuming 350–450 net rentable sf/unit and modern common spaces. (Synthesis of CBRE, trade coverage, and current contractor briefs.) CBRE, Senior Housing News
Permitting and regulatory friction can materially inflate carrying costs. Example: Hawaii research shows outsized regulatory cost burden in residential development—a cautionary signal for any island/coastal entitlement path. AP News
Care Revenue Model (Illustrative):
Underwriting guardrails (stabilized, private-pay AL):EBITDA margin: 24–32% ; Management fee: 5–6% EGI; Capex reserve: $300–$400/unit-yr (Class A) rising with building complexity. (Synthesis of ASHA benchmarks + market commentary.) Senior Housing News
Demand strength blends share of 65+ and 80+ cohorts , migration inflows , household wealth , and limited new supply . Current indicators:
“Demand Score” (illustrative, combining 65+ share, migration trend, and low inventory growth):
Rank
State
Example High-Demand Metros
Why It Scores
Florida
Tampa, Orlando, Naples
High 65+ share, strong in-migration, constrained new starts
Arizona
Phoenix, Tucson
Rapid senior growth, Sun Belt migration
Texas
DFW, Austin, San Antonio
Nation-leading population growth; select senior hubs growing fast
South Carolina
Myrtle Beach, Greenville
Fastest-growing senior metro; coastal draw
North Carolina
Raleigh-Durham, Charlotte
In-migration + high HH incomes
Tennessee
Nashville, Knoxville
65+ rising to ~20% by 2040; business-friendly
Georgia
Atlanta suburbs, Savannah
Migration + relative affordability
Nevada
Las Vegas, Reno
Retiree in-migration, tax climate
Maine
Portland, Bangor
Very high 65+ share; limited supply
10
Colorado
Denver exurbs, Colorado Springs
Affluent households; limited infill supply
(Sources reflect recent occupancy/supply signals, demographic shares, and migration coverage.) Houston Chronicle, National Investment Center, World Population Review
Region
Typical Range (AL, stabilized plan)
Notes
Coastal urban/infill (CA, MA, WA, HI)
$80k–
Tight sites, lengthy entitlements; financing carry adds risk. CBRE+1
High-growth Sun Belt suburbs (FL, TX, AZ, NC, SC, TN, GA)
Abundant entitled suburban parcels; premiums for corner visibility. CBRE
Heartland & tertiary
Lower land costs but smaller qualified demand radius. CBRE
These ranges derive from site-acquisition shares in CBRE’s development study combined with current AL hard/soft cost contexts and typical GBA/unit assumptions. Always verify with recent broker land comps and municipal fees. CBRE
Variable
Base Case
Low Case
High Case
Impact
Total Dev Cost/Unit
$400,000
$350,000
$475,000
Affects return on cost; leverage limits
Average AL Rent
$5,900
$5,400
$6,400
RevPAR & margin swing driver Carescout
Lease-Up to 90%
24 months
30 months
18 months
Carry, TI/marketing burn
Care Fees/Unit (avg)
$900
ADL intensity & staffing mix
OpEx/Unit/Month
$3,500
$3,800
$3,200
Wages, insurance, utilities
Stabilized EBITDA Margin
28%
24%
32%
Value & DSCR tolerance Senior Housing News
Exit Cap (AL/MC)
6.75%
7.25%
6.25%
Sensitivity to rate regime
Q1. What’s the current national occupancy and why is it rising?A. NIC reports 88.1% occupancy in Q2 2025 across primary markets, with inventory growth under 1% due to years of low new starts—demand is outpacing supply. National Investment Center
Q2. What does it cost to build an Assisted Living Facility today?A. Inclusive of land, softs, and FF&E, many projects pencil $325k–$450k per unit in Sun Belt/Heartland metros, $450k–$650k+ in coastal/infill. Hard costs often
Q3. How long will lease-up take?A. Plan 18–30 months to stabilization. Strong pre-leasing and first-year momentum are critical; NIC shows first-year velocity heavily influences outcomes. Senior Housing News
Q4. What are typical Assisted Living Facility room rates?A. The national median AL rate was $5,900/month (2024) . Private rooms trend higher; semi-private lower. Memory care often ranges ~$6,100–$7,300+ nationally. Carescout
Q5. How do ADLs/IADLs affect revenue?A. ADLs (e.g., bathing, dressing) and IADLs (e.g., meds, shopping) define care tiers and fees. Clear documentation supports pricing and compliance. Centers for Medicare & Medicaid Services
Q6. What EBITDA margins are achievable?A. Stabilized AL/AL+MC commonly underwrite ~24–32% EBITDA margins , with IL-heavy mixes often higher. 2023 ASHA medians: IL ~32.5%, AL components ~29.2%, mixed campuses ~26.6%. Senior Housing News
Q7. Which states and cities show the greatest demand right now?A. Florida, Arizona, Texas, the Carolinas, Tennessee, Georgia lead on senior growth and in-migration; Myrtle Beach, SC is the fastest-growing senior metro, and Texas led absolute population growth in 2024. Pair this with low new starts to find the best submarkets. AP News, Houston Chronicle
Q8. What’s land per bed by state?A. There’s no one number: CBRE’s study places site acquisition ~8.2% of total development cost on average. Translating to per-bed often yields
The Assisted Living Facility thesis in 2025 is straightforward: aging demand is accelerating while new supply remains historically constrained. That combination supports rents, absorption, and margins—but only for projects that buy the dirt right , control costs , design for care acuity , and win the first year of lease-up .
One external resource to track monthly: the NIC blog & NIC MAP Vision updates for occupancy, rate growth, and pipeline—crucial for timing new starts and underwriting rent growth. National Investment Center, National Investment Center
Sources referenced throughout:
Donald Safranek, President, Wert-Berater, Inc. Feasibility Study Consultants Feasibility Study Consultants
Wert-Berater, Inc.
1968 South Coast Highway
Suite 2382
Laguna Beach CA 92651

President, Wert-Berater, Inc. — independent feasibility study consultants since 1998. More than 4,000 feasibility studies completed across all 50 states and internationally, evaluating $40.2 billion in project value for SBA, USDA, EB-5, conventional, and institutional financing decisions. Fiduciary duty runs to the lender and agency in every engagement.
+1 310-857-2443 ext. 800 · email · 1968 South Coast Hwy, Ste 2382, Laguna Beach, CA 92651 · 111 Town Square Pl Ste 1238 PMB 657834, Jersey City, NJ 07310 · 539 W. Commerce St #8486, Dallas, TX 75208
Schedule a ConversationIndependent feasibility studies since 1998 — 4,000+ engagements, $40.2 billion in evaluated project value. Standard delivery in 10 to 15 business days. Fiduciary duty to the lender and agency.