
Lender and owner summary. A physician shortage does not prove that a cash-pay practice will be profitable. This analysis separates healthcare need, cash-pay purchasing power and competitive pressure, screens all 58 California counties on verified, dated data, and provides working calculators for market sizing, a 36-month monthly projection with sensitivities, and an illustrative amortizing loan. All dollar figures in the examples are hypothetical.
Introduction: Is California a Viable Market for a Cash-Pay Primary Care Practice?
California presents a significant opportunity for healthcare entrepreneurs considering a cash-pay primary care practice, direct primary care (DPC) membership model, concierge medical practice, or hybrid primary care business. The state has a large population, substantial differences in household income, considerable geographic variation in physician availability, and communities experiencing difficulty accessing traditional primary care.
However, a large population and a shortage of physicians do not automatically establish that a cash-pay medical practice will be profitable.
A successful investment requires a more detailed evaluation. An entrepreneur must determine where patients are located, how many can afford recurring membership fees, how many competing providers already serve the market, whether existing healthcare systems meet local demand, what patients are willing to pay, and how many paying members a new practice can realistically acquire.
The most important question is not simply whether California needs more primary-care providers. It is whether a particular geographic market has enough economically qualified, accessible, and underserved potential patients to support a new practice at a sustainable operating margin.
Wert-Berater, Inc. evaluates these questions through independent market research, demographic analysis, healthcare supply-and-demand analysis, financial modeling, investment analysis, and feasibility studies.
This California cash-pay primary care market analysis examines California's healthcare market and introduces a county-level market heat map designed to identify potential investment locations, underserved markets, competitive markets, and areas where additional supply may be difficult to justify.
1. What Is Cash-Pay Primary Care?
Cash-pay primary care is a medical practice in which patients pay the provider directly rather than relying entirely on traditional insurance reimbursement for primary-care services.
There are several different business models.
Direct Primary Care (DPC)
Direct primary care generally operates through a recurring monthly or annual membership. Members pay a predetermined fee for defined primary-care services and access to their physician.
A typical membership may include:
- Routine office visits.
- Preventive care.
- Chronic-condition management.
- Longer appointments.
- Telephone and electronic communication.
- Follow-up consultations.
- Certain basic procedures.
- Discounts on selected laboratory services or medications, where permitted.
The precise services included in a membership agreement vary by practice.
Cash-Pay Fee-for-Service
Patients pay directly for individual appointments, consultations, examinations, or other services. The practice does not necessarily require a recurring membership.
This model can generate revenue from patients who prefer to pay only when they need care.
Concierge Medicine
Concierge practices generally charge a membership or retainer fee for enhanced access, personalized service, and additional physician availability. Some concierge practices continue to bill insurance for covered medical services.
Hybrid Medical Practice
A hybrid model may combine memberships, direct payments, and insurance reimbursement. The financial and regulatory implications depend on the services offered, contractual structure, and applicable law.
Important distinction: These models should not be treated as interchangeable. A feasibility study must identify the precise revenue model, services, patient population, payment structure, and regulatory requirements before estimating demand or profitability.
2. California Healthcare Market: Population, Demand and Access
California is one of the largest healthcare markets in the United States. Its population, urban concentration, rural communities, aging population, chronic-care needs, and income differences create multiple potential markets for primary-care services.
The California Department of Finance (E-2 estimates) estimated the state's population at approximately 39,529,000 as of July 1, 2025 (the downloadable county estimates reconcile to 39,528,899).
California's statewide primary-care access indicator (Let's Get Healthy California) reported approximately 1,199 residents per primary-care physician using 2022 data. The indicator measures physicians in specified primary-care specialties and does not include every nurse practitioner, physician assistant, or other provider who may deliver primary care.
The distinction matters. A market analysis should not confuse the physician supply ratio with the total supply of all primary-care professionals.
As of December 31, 2025, KFF reported 661 primary-care Health Professional Shortage Area (HPSA) designations in California, a designated-area population of 6,905,819 (approximately 6.91 million), 53.62% of need met, and 1,045 additional practitioners needed to remove the designations.
Caveat on the 6.91 million figure. KFF notes that HPSA designations and their populations can overlap, so totals may double-count residents. The figure is a sum of designated-area populations, not a count of unique unserved people, and it should not be used as a market size.
These figures indicate significant access challenges, but they do not establish that all affected residents can afford or would choose a cash-pay membership.
The market must be evaluated from both a healthcare-access perspective and a consumer-purchasing perspective.
3. California County-Level Healthcare Market Heat Map
Identifying Underserved Markets, Cash-Pay Opportunities and Potential Oversupply
A statewide average conceals substantial differences between California counties and even between neighborhoods within the same county.
For that reason, a serious California cash-pay primary-care market analysis should include an interactive county-level heat map covering all 58 California counties.
The map should not merely show population or physician counts. It should combine multiple economic, demographic, healthcare-access, and competitive indicators.
The purpose is to identify:
- Counties with substantial unmet primary-care demand.
- Counties with adequate income and population density to support cash-pay memberships.
- Counties with high medical need but limited ability to support a premium membership model.
- Counties with strong purchasing power but substantial competition.
- Counties where provider supply may be relatively high compared with addressable demand.
- Counties that warrant more detailed neighborhood-level research.
Interactive California County Screening Map
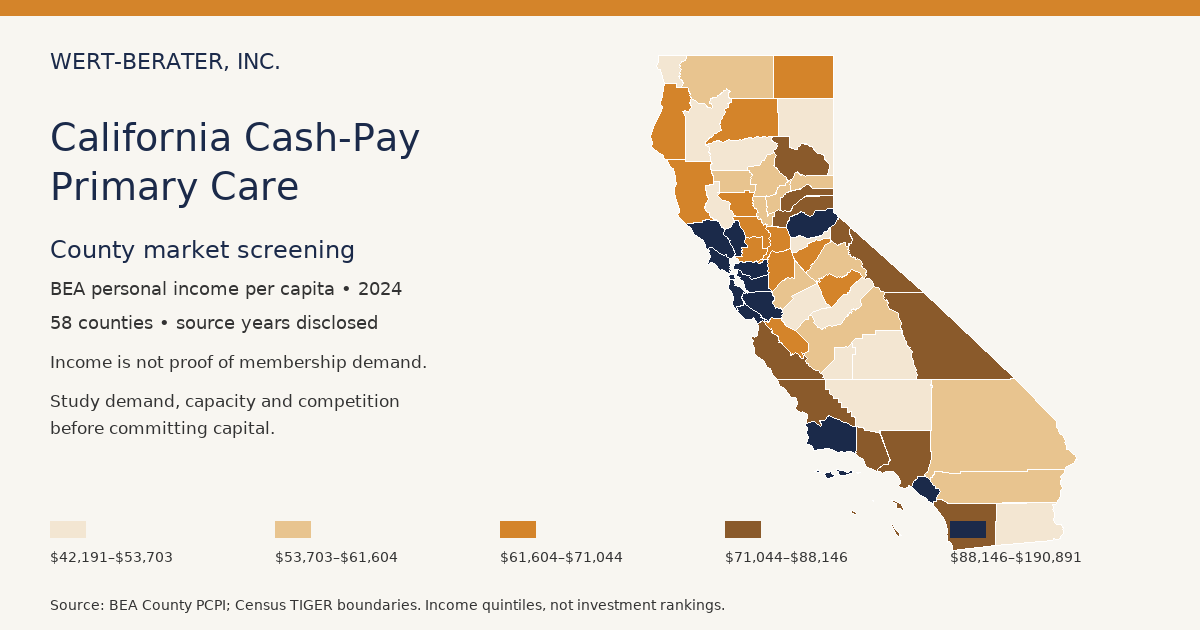
This choropleth is drawn from geographic county boundaries for all 58 counties and joined to county data by FIPS code. It is a screening tool built from verified, dated public data. Only verified numeric indicators are colored. Where a county lacks a verified value, the map shows Data unavailable, never zero. Score layers show Insufficient Data until every required verified component exists; no rank is estimated to fill a gap. Primary-care HPSA designation IDs are listed separately by geographic, population-group and facility type; these counts do not establish countywide resident exposure. Overlap-safe shortage exposure, active primary-care NP/PA supply, and verified competitor and capacity measures remain incomplete, so the need, commercial, competitive, oversupply and composite scores remain Insufficient Data. Physician supply, population density, income, poverty and insurance estimates can be compared descriptively, with source periods and provisional review flags retained. County data last verified: pending.
The interactive map loads with JavaScript. If it does not appear, the methodology, classifications and research priorities below remain complete.
All 58 counties as a table (current layer)
| County | Value | Preliminary classification |
|---|
Source register: definitions, data years and limitations
| Source | Data year | Definition | Limitation |
|---|
The physician layer uses CHCF's 2025 Physicians Almanac, Appendix C: 2023 active patient-care primary-care MD counts and rounded rates for all 58 counties, verified against the source table. These MDs reported at least 20 patient-care hours weekly. The measure excludes DOs, NPs, PAs, residents, fellows and survey nonrespondents; nine primary-care MDs lacked geographic information. Alpine and Sierra have a published count and rate of zero: this is not evidence of no access to primary care. Residents per MD is an approximation from the inverse rounded rate, and is unavailable for a zero rate. The older 2021 CHR observations remain historical data, not a like-for-like trend. Income and population retain their own sources and years; the supplied file's blank fields did not replace existing values.
Data Methodology
Population and density come from California Department of Finance and Census estimates (2025 county population; 2024 to 2025 growth). They measure residents, not customers.
Provider supply measures physicians in defined primary-care specialties per 100,000 residents. Definitions differ by source: County Health Rankings (data year 2021), the CHCF Physicians Almanac (2023 active patient-care MDs, including county-level Appendix C) and the Let's Get Healthy California statewide indicator (2022). The map uses CHCF's 2023 county rates. Nurse practitioners and physician assistants are reported separately where consistent data exist.
HPSA designations are federal (HRSA) shortage designations for areas, populations or facilities. Designations and populations can overlap. PCSA designations are California's state Primary Care Shortage Areas with their own methodology. Neither proves cash-pay demand.
Competitor data from commercial directories are listings, not a registry; they must be independently verified before any competitor density is colored.
Income: per-capita personal income (BEA) includes transfer and investment income and is not median household income (SAIPE/ACS) or disposable income.
A. The Five Heat-Map Dimensions
Dimension 1 — Population and Population Density
Measure:
- Total county population.
- Population per square mile.
- Population growth.
- Urban versus rural distribution.
- Population within practical driving distances of potential clinic locations.
- Household size.
- Population age distribution.
- Working-age population.
- Population aged 65 and older.
Population density is important because it affects the number of potential members within a practical service area. A large rural county may have a substantial population but a geographically dispersed customer base. A smaller urban county may have a much larger concentration of potential patients within a five- or ten-mile radius.
Dimension 2 — Per-Capita Income and Purchasing Power
Use county-level per-capita personal income from the Bureau of Economic Analysis, supplemented by Census American Community Survey household income, poverty, and insurance information.
The 2024 per-capita personal income data (BEA, all 58 counties verified; selected counties shown) illustrate substantial differences:
| County | Per-capita personal income |
|---|---|
| Marin | $190,891 |
| San Mateo | $179,656 |
| San Francisco | $171,497 |
| Santa Clara | $157,620 |
| Alameda | $111,268 |
| Contra Costa | $108,259 |
| Orange | $94,034 |
| Los Angeles | $83,888 |
| Kern | $50,641 |
| Kings | $47,718 |
These figures are per-capita personal income, not median household income, disposable income, or proof of willingness to purchase private medical memberships.
The heat map should use income as one indicator of potential purchasing power, not as a substitute for consumer research.
Dimension 3 — Primary-Care Provider Density and Supply
Measure:
- Primary-care physicians per 100,000 residents.
- Residents per primary-care physician.
- Family medicine providers.
- General internal medicine providers.
- General practitioners.
- Pediatric primary-care providers where relevant.
- Nurse practitioners and physician assistants, reported separately.
- Active patient-care providers.
- Geographic distribution of practices.
- Competing medical facilities.
Provider supply should be measured using consistent definitions and dates.
The California Health Care Foundation's 2025 Physicians Almanac provides primary-care MD supply information based on 2023 active patient-care data. Appendix C publishes county counts and rounded rates for all 58 counties. The supplied county file was checked against all 58 source rows and is now used in the map above. It identifies substantial geographic variation, but county averages do not establish appointment availability, patient capacity or cash-pay demand.
Dimension 4 — Unmet Demand and Healthcare Access
Measure:
- Primary-care HPSA designations.
- California Primary Care Shortage Area designations.
- Residents living in shortage areas.
- HPSA percentage of need met.
- Additional practitioners needed.
- Residents without a personal physician.
- Uninsured population.
- Medicaid/Medi-Cal enrollment and provider availability.
- Travel distance to primary-care providers.
- Appointment availability, where verifiable.
- Population growth relative to provider growth.
A shortage designation is evidence of an access problem. It is not proof of demand for a cash-pay membership. The study must determine whether the affected population can afford the proposed product and whether the practice can reach that population.
Dimension 5 — Competition and Potential Oversupply
Measure:
- Direct primary-care practices.
- Concierge practices.
- Cash-pay primary-care practices.
- Traditional primary-care offices.
- Hospital-affiliated outpatient clinics.
- Federally Qualified Health Centers.
- Urgent-care facilities.
- Retail clinics.
- Telehealth providers.
- Number of competing providers per 100,000 residents.
- Competitor locations and geographic coverage.
- Published membership prices.
- New-patient availability, where verified.
- Services and hours.
- Estimated competitive capacity.
A county should not be classified as oversupplied solely because it has a high number of physicians. Oversupply must be evaluated relative to population, demand, provider capacity, competition, and the specific cash-pay customer segment.
B. County Heat-Map Scoring Methodology
The heat map should provide separate scores for healthcare need, cash-pay commercial potential, and competitive pressure.
A suggested preliminary scoring framework is:
| Indicator | Suggested weight |
|---|---|
| Primary-care shortage and access indicators | 25% |
| Primary-care provider supply gap | 20% |
| Population density and addressable population | 15% |
| Per-capita income and household purchasing power | 20% |
| Competition and estimated market saturation | 20% |
The initial weights are proposed analytical assumptions. They must be tested and adjusted during actual market research.
Create three distinct scores:
Healthcare Need Score: Measures the extent of primary-care access challenges and provider shortages. Preliminary components: HPSA and PCSA indicators 35%; physician shortage 35%; access barriers and residents without a personal physician 20%; population growth or demographic pressure 10%.
Cash-Pay Commercial Potential Score: Measures whether population density, income, household characteristics, and estimated willingness to pay support the proposed membership model. Preliminary components: per-capita and household income 30%; density and addressable population 25%; age and household characteristics 15%; estimated purchasing power 15%; local market growth 15%.
Competitive Pressure Score: Measures the number, location, capacity, and market presence of competing providers. Preliminary components: DPC and concierge competitor density 35%; conventional primary-care provider density 25%; healthcare-system and clinic presence 20%; estimated competing service capacity 20%.
A fourth composite score may be presented as a preliminary investment-screening indicator, but it must not hide the three underlying scores.
Default composite opportunity = (Healthcare Need × 0.40) + (Commercial Potential × 0.40) + ((100 − Competitive Pressure) × 0.20)
Each component is normalized 0 to 100 across counties that have the verified measure. If any required component is missing for a county, that score and the composite display Insufficient Data. These are preliminary model settings, not established industry standards.
C. Proposed Heat-Map Classifications
Use the following classifications:
The map must display the classification and underlying data when a user selects a county.
D. Preliminary Geographic Market Signals
The available statewide data suggest several geographic patterns that deserve further investigation. This is preliminary regional research, not a ranking.
Coastal and Bay Area Counties
Marin, San Mateo, San Francisco, Santa Clara, Alameda, and Contra Costa have relatively high per-capita personal income. These counties may support higher-priced memberships, but they also have established healthcare systems, physician practices, concierge providers, and potentially higher operating costs.
The correct question is whether an individual neighborhood or customer segment remains underserved despite the presence of significant healthcare supply.
Southern California
Los Angeles, Orange, and San Diego counties contain large population concentrations and diverse income segments. These markets should be examined at the ZIP-code and neighborhood levels. County-wide averages can conceal both affluent, competitive neighborhoods and areas with substantial access limitations.
Sacramento and Surrounding Counties
Sacramento, Placer, El Dorado, Yolo, and surrounding communities warrant evaluation based on population growth, household income, provider availability, and competition. The analysis should distinguish established urban supply from growing suburban service areas.
Central Valley and Inland Counties
Kern, Fresno, Tulare, Kings, Merced, and San Joaquin counties deserve detailed access and affordability analysis. Lower physician availability in some inland areas may indicate unmet healthcare need, but lower per-capita income in several counties may constrain the viability of a premium membership-only business.
Potential business models may differ substantially between these counties. A lower-priced membership, employer-sponsored program, hybrid practice, or partnership model may be more appropriate than a premium concierge operation.
Northern and Rural California
Counties such as Del Norte, Siskiyou, Modoc, Trinity, Lassen, and other rural areas should be evaluated for geographic access barriers, population dispersion, provider availability, and local purchasing power.
A county may have substantial healthcare need but insufficient population concentration to support a traditional fixed-location clinic. Mobile services, employer contracts, telehealth-supported care, or multi-location arrangements may warrant evaluation, subject to applicable law and reimbursement rules.
Important: These are preliminary geographic research priorities, not definitive county investment rankings. The final heat map must calculate each county's scores from verified, dated source data. It must not assign a county a high-potential or oversupply classification simply because of its reputation, income level, or physician count.
E. Neighborhood-Level Analysis Is Essential
A county-level heat map is a screening tool, not a substitute for a site-specific feasibility study.
Once a county is identified as attractive, the analysis should examine:
- ZIP codes.
- Census tracts.
- Five-, ten-, and fifteen-minute drive-time areas.
- Nearby physician practices.
- Household income.
- Population density.
- Employer concentrations.
- Medical-office locations.
- Competing DPC and concierge providers.
- Local medical-office rental costs.
- Traffic and accessibility.
The final study should identify specific potential trade areas rather than merely recommend an entire county.
4. How Many Direct Primary-Care Competitors Are in California?
Competitor research is essential because the number of existing practices affects pricing, patient acquisition costs, and achievable membership growth.
The Tabflows DPC Finder California directory, inspected November 5, 2026, reports 296 direct-primary-care and concierge listings across 119 cities. Of those listings, 52 publish an individual monthly starting price. The directory reports a typical starting price of approximately $123 per month, ranging from $50 to $400 among published prices. This is a dated directory snapshot, not a verified census of operating practices or a representative statewide price survey; the underlying practices, prices, and new-patient capacity must be checked individually.
This is a directory-based market indicator, not a complete government registry or independently verified census of every California practice.
A professional feasibility study should independently verify competitors through:
- Practice websites.
- Medical Board license records.
- Business directories.
- Google Business Profiles.
- Local searches.
- Telephone verification where appropriate.
- Published service and membership information.
- Available appointment information.
The study should distinguish pure DPC from concierge medicine, hybrid practices, and conventional insurance-based primary care.
A practice that charges $125 per month but includes a different service package should not be treated as directly equivalent to a practice charging $250 per month for expanded services.
5. Customer Demand: Who Will Pay for Cash-Pay Primary Care?
A cash-pay practice needs a defined customer segment. The general population is not the same as the addressable market.
Potential customer segments include:
Higher-Income Individuals and Families
Customers who value physician access, convenience, continuity, and longer appointments may be willing to pay recurring membership fees.
Self-Employed Individuals and Small Business Owners
Some individuals may prefer predictable direct payments and convenient access to a physician.
High-Deductible Health Plan Members
Some patients may seek predictable primary-care costs while maintaining separate insurance coverage for major medical expenses. The practice must explain what is and is not covered.
Uninsured or Underinsured Patients
This population may have unmet demand, but affordability and price sensitivity require particular attention. A premium DPC model should not assume that uninsured residents can afford recurring memberships.
Retirees
Older residents may value continuity, convenience, and chronic-condition management. The practice must carefully evaluate Medicare participation, billing, membership arrangements, and applicable federal and state requirements.
Employers
Small and midsized businesses may consider direct primary-care arrangements as part of an employee benefit strategy. Employer-sponsored arrangements can create a different acquisition and revenue model.
Demand Estimation
The study should estimate the addressable market using a transparent sequence:
- Establish the population within the proposed trade area.
- Identify the relevant age and household segments.
- Estimate the population with characteristics aligned with the proposed service.
- Evaluate household income and purchasing power.
- Identify competing practices and alternative healthcare options.
- Estimate realistic membership conversion rates.
- Calculate the number of members needed for break-even.
- Compare projected membership with realistic provider capacity.
Do not apply a generic percentage of the county population and call it market demand.
The final demand estimate should show the data source, calculation, assumptions, and limitations.
The interactive market calculator requires JavaScript. The calculation sequence above can be applied manually.
6. Startup Costs: How Much Does It Cost to Open a Cash-Pay Primary-Care Practice in California?
Startup costs depend on the location, size, construction requirements, equipment, staffing, technology, and working-capital requirements.
A small practice may require considerably less capital than a multi-provider clinic with extensive construction and additional services.
The following is an illustrative startup budget for a hypothetical practice. It is not a California market average or a contractor quotation.
| Startup cost | Illustrative amount |
|---|---|
| Leasehold improvements | $120,000 |
| Medical equipment | $60,000 |
| Electronic health records and IT | $25,000 |
| Furniture, fixtures and signage | $25,000 |
| Legal, licensing and professional costs | $30,000 |
| Deposits and pre-opening occupancy | $20,000 |
| Marketing and launch expenses | $25,000 |
| Initial working capital | $250,000 |
| Contingency | $45,000 |
| Total illustrative project cost | $600,000 |
A real project budget should obtain local contractor estimates, medical equipment quotations, lease proposals, technology costs, insurance quotations, staffing assumptions, and professional-service estimates.
Working capital is particularly important. A new practice may require several months to build its membership base while payroll, rent, software, insurance, marketing, and other operating expenses continue.
7. Staffing and Operating Requirements
A cash-pay primary-care practice may require:
- Physician or appropriately licensed clinical provider.
- Medical assistant.
- Front-office and patient-service personnel.
- Practice manager.
- Billing or bookkeeping support, if applicable.
- Electronic health records.
- Scheduling and communication systems.
- Medical malpractice coverage.
- General liability and business insurance.
- Medical supplies.
- Laboratory arrangements.
- Marketing and patient acquisition.
Staffing must be aligned with projected membership and clinical capacity.
The financial model should not assume that one physician can serve an unlimited number of members. Appointment frequency, average visit duration, administrative work, messaging, clinical complexity, and coverage requirements all affect capacity.
8. Membership Pricing and Revenue Model
A DPC practice may charge a monthly membership, annual fee, or another permitted direct-payment arrangement.
The following is an illustrative pricing model:
| Membership type | Illustrative monthly fee |
|---|---|
| Individual | $125 |
| Couple | $225 |
| Family | $300 |
| Employer-sponsored member | Negotiated |
These are hypothetical model inputs, not a recommendation or verified statewide market average.
A feasibility study should evaluate multiple pricing scenarios. A lower monthly fee may attract more customers but require a larger membership base. A higher fee may improve revenue per member but reduce the number of households willing to enroll.
Revenue may also include separately priced services where legally permitted and consistent with the membership agreement.
The model must avoid double-counting services already included in membership revenue.
9. Three-Year Illustrative Financial Projection
The following example demonstrates how a hypothetical practice might perform as membership increases.
It is not a forecast of actual California practice performance.
| Financial measure | Year 1 | Year 2 | Year 3 |
|---|---|---|---|
| Average paying members | 300 | 500 | 700 |
| Membership revenue | $450,000 | $750,000 | $1,050,000 |
| Additional service revenue | $25,000 | $40,000 | $55,000 |
| Total revenue | $475,000 | $790,000 | $1,105,000 |
| Operating expenses | $564,000 | $680,000 | $802,000 |
| EBITDA | ($89,000) | $110,000 | $303,000 |
| Illustrative annual debt service | $90,000 | $90,000 | $90,000 |
| Cash flow after debt service | ($179,000) | $20,000 | $213,000 |
This example illustrates the importance of adequate startup capital and realistic membership growth assumptions.
The first year produces a substantial operating loss. The practice does not become cash-flow positive merely because membership revenue increases. The owner must have sufficient working capital to support the ramp-up period.
The projection must be rebuilt using the actual proposed location, staffing plan, pricing, construction budget, loan terms, and market research.
Break-Even Analysis
A simplified membership break-even formula is:
Break-even members = Fixed operating costs ÷ Monthly contribution per member
For example, if monthly fixed costs are $45,000 and the contribution per member after variable costs is $100 per month:
45,000 ÷ 100 = 450 members.
The practice would require approximately 450 paying members to cover the modeled fixed costs before considering debt service, taxes, owner distributions, and other excluded items.
A full financial model must distinguish:
- Fixed costs.
- Variable costs.
- Semi-variable costs.
- Membership revenue.
- Additional service revenue.
- Owner compensation.
- Debt service.
- Taxes.
- Replacement capital expenditures.
- Working-capital requirements.
The interactive projection requires JavaScript. The illustrative tables above remain the reference example.
10. Financial Feasibility and Lender Underwriting
A lender-grade financial analysis should include more than a three-year income statement.
The financial model should include:
- Ten-year projections.
- Monthly operating projections during the startup and ramp-up period.
- Revenue by membership category.
- Patient acquisition assumptions.
- Membership churn and retention.
- Staffing costs.
- Payroll taxes and benefits.
- Medical supplies.
- Occupancy costs.
- Insurance.
- Software and technology.
- Marketing.
- Professional fees.
- Construction and equipment costs.
- Working capital.
- Loan proceeds and equity.
- Debt amortization.
- Interest-rate sensitivity.
- Cash flow.
- Balance sheet.
- Income statement.
- Debt service coverage ratio.
- Break-even analysis.
- Sensitivity analysis.
- Downside scenarios.
Important Financial Ratios
Debt Service Coverage Ratio (DSCR)
Measures the cash flow available to service debt relative to required debt payments. The exact numerator and calculation should follow the lender's underwriting methodology.
EBITDA Margin
Measures operating earnings before interest, taxes, depreciation, and amortization relative to revenue.
Current Ratio
Measures current assets relative to current liabilities.
Quick Ratio
Measures the ability to meet short-term obligations using more liquid current assets.
Debt-to-Worth
Evaluates financial leverage relative to the owner's equity.
Customer Acquisition Cost (CAC)
Measures the cost of acquiring a new paying member.
Member Churn
Measures the percentage of memberships lost during a specified period.
Member Lifetime Value (LTV)
Estimates the economic value of a member over the expected relationship period.
Sensitivity Analysis
At a minimum, test:
- Membership enrollment 10%, 20%, and 30% below forecast.
- Membership pricing 5% and 10% below forecast.
- Payroll 10% and 15% above forecast.
- Construction costs 10% and 20% above budget.
- Opening delays of three and six months.
- Higher interest rates.
- Lower patient retention.
- Higher customer acquisition costs.
- Lower physician capacity.
- Increased malpractice and insurance costs.
A lender should understand whether the project can survive a reasonable downside scenario, not merely whether it works under the owner's preferred assumptions. The projection model runs the enrollment, pricing, payroll, construction, opening-delay and interest-rate cases automatically; retention, acquisition cost, capacity and insurance can be tested by editing those inputs.
11. SBA Financing for Cash-Pay Primary-Care Practices
SBA financing may be an option for eligible healthcare businesses, subject to the lender's underwriting, SBA program requirements, business structure, use of proceeds, and other applicable conditions.
SBA 7(a) Loan Program
The SBA 7(a) program may support eligible business purposes, including working capital, equipment, leasehold improvements, and certain business acquisitions or refinancing, subject to program rules.
For a startup medical practice, the lender will generally want to understand:
- Total project cost.
- Owner equity contribution.
- Startup experience.
- Provider qualifications.
- Market demand.
- Financial projections.
- Working capital.
- Management capability.
- Collateral and guarantees, as applicable.
- Ability to repay.
SBA 504 Loan Program
The SBA 504 program is generally designed for eligible fixed-asset financing, such as owner-occupied commercial real estate and qualifying long-term equipment.
It should not be presented as a general working-capital program.
A medical practice purchasing an eligible owner-occupied property or financing qualifying fixed assets may wish to investigate this option with an SBA 504 lender or Certified Development Company.
SBA Microloan Program
The SBA Microloan program may be relevant to smaller eligible financing needs. Its permitted uses and intermediary requirements should be reviewed before including it in a project financing plan.
Why an Independent Feasibility Study Matters
A lender may request an independent feasibility study or market analysis to evaluate whether a proposed healthcare business has sufficient market support and financial capacity.
The study should address:
- Market demand.
- Existing and proposed competition.
- Geographic service area.
- Demographic and income characteristics.
- Pricing.
- Membership penetration.
- Provider capacity.
- Project costs.
- Operating expenses.
- Financial projections.
- Debt service.
- Downside risk.
- Regulatory and operating considerations.
A business plan describes the owner's intended operation. A feasibility study independently tests whether the market and financial assumptions are supportable.
No feasibility study guarantees loan approval or replaces the lender's own underwriting.
12. California Legal and Regulatory Considerations
A cash-pay medical practice must be structured and operated in accordance with applicable California and federal requirements.
Potential areas of review include:
- California corporate practice of medicine restrictions.
- Permissible professional medical entity structures.
- Management services organization arrangements.
- Physician ownership and control.
- Medical Board of California requirements.
- Membership agreements.
- Prepaid healthcare and insurance regulatory issues.
- Knox-Keene Act considerations, where applicable.
- Medicare participation and billing.
- Medi-Cal participation and billing.
- HIPAA privacy and security.
- Telehealth requirements.
- Professional liability.
- Employment and contractor arrangements.
- Laboratory and diagnostic-service arrangements.
- Advertising and patient disclosures.
The legal analysis must be specific to the actual business model. A direct-payment arrangement is not automatically exempt from every insurance, prepaid-healthcare, or professional-practice requirement.
Wert-Berater's market and financial feasibility analysis is not a legal opinion. The owner should obtain advice from qualified California healthcare counsel before finalizing the entity structure, membership agreement, or operating model.
13. SWOT Analysis: California Cash-Pay Primary Care
Strengths
- Large statewide population.
- Established demand for primary-care services.
- Potential for recurring membership revenue.
- Opportunity to differentiate through convenience and access.
- Potential employer-sponsored arrangements.
- Potential to build long-term patient relationships.
Weaknesses
- Membership acquisition takes time.
- Startup expenses can be substantial.
- Physician capacity limits revenue.
- Membership churn creates recurring sales requirements.
- Cash-pay affordability varies considerably.
- A new practice may lack established brand recognition.
Opportunities
- Underserved communities.
- Growing suburban populations.
- Employer-sponsored primary-care arrangements.
- Specialized primary-care service packages.
- Hybrid business models.
- Neighborhoods with limited appointment availability.
- Markets where existing providers do not offer the desired patient experience.
Threats
- Established hospital systems.
- Insurance-based primary-care practices.
- Concierge competitors.
- Retail and urgent-care alternatives.
- Provider recruitment challenges.
- Rising labor and occupancy expenses.
- Regulatory uncertainty.
- Slower-than-projected enrollment.
- Economic downturns affecting discretionary spending.
14. PESTEL Analysis
Political: California healthcare policy, public healthcare programs, provider workforce initiatives, and regulatory changes.
Economic: Inflation, interest rates, labor costs, household purchasing power, insurance costs, and commercial occupancy expenses.
Social: Aging population, chronic disease, consumer expectations, patient convenience, and access to primary care.
Technological: Electronic health records, telehealth, remote monitoring, digital scheduling, cybersecurity, and patient communications.
Environmental: Facility requirements, energy expenses, building accessibility, and geographic exposure to local environmental risks.
Legal: Corporate practice of medicine, professional licensing, patient privacy, prepaid healthcare, Medicare, Medi-Cal, and employment law.
15. Why a Professional Feasibility Study Is Essential
A healthcare entrepreneur may have an attractive concept and a strong clinical background. Neither establishes that the proposed business will succeed in a particular market.
A professional feasibility study should independently determine whether the proposed market has sufficient demand, whether competition is manageable, whether patients can afford the proposed services, and whether the practice can generate enough cash flow to support operations and repay debt.
The analysis should provide a defensible answer to the following questions:
- Is there an identifiable market for the proposed practice?
- How many potential customers are within the trade area?
- What is the competitive supply?
- What is the estimated unmet demand?
- What membership pricing is supportable?
- How many members are needed to break even?
- Can the physician and staff serve the projected membership?
- How much startup capital is required?
- How much working capital is necessary?
- Can the project support its proposed debt?
- What happens if enrollment is delayed or below forecast?
- Should the owner proceed, modify, relocate, delay, or abandon the project?
A feasibility study should not simply confirm the owner's expectations. It should identify weaknesses, quantify risks, and provide an independent assessment.
16. How Wert-Berater Supports Healthcare Entrepreneurs and Lenders
Wert-Berater, Inc. provides independent market intelligence, feasibility studies, financial modeling, business analysis, and investment research.
For a proposed cash-pay primary-care practice, the engagement may include:
- Statewide and county-level healthcare market analysis.
- County-level market heat maps.
- Population and demographic analysis.
- Per-capita income and household purchasing-power analysis.
- Primary-care physician supply analysis.
- Shortage-area and unmet-demand analysis.
- Direct primary-care and concierge competitor research.
- Market saturation and potential oversupply analysis.
- Trade-area and site evaluation.
- Startup cost analysis.
- Membership pricing analysis.
- Ten-year financial modeling.
- Break-even and sensitivity analysis.
- Debt service coverage analysis.
- SBA financing support analysis.
- Risk assessment.
- Independent feasibility conclusions.
The purpose is to provide owners, investors, and lenders with a more complete understanding of the proposed investment before significant capital is committed.
Wert-Berater — Independent Market Intelligence & Feasibility Advisory
Since 1998 · Independent Analysis · Market Research · Financial Modeling · Feasibility Studies · Lender and Investor Support
Engagement scope and fee are confirmed in writing before work begins. A study does not guarantee financing or SBA approval; the lender's own underwriting controls.
17. Frequently Asked Questions
Is cash-pay primary care profitable in California?
It can be profitable, but profitability depends on location, membership pricing, patient acquisition, staffing, provider capacity, competition, operating expenses, and retention. A market with high healthcare need may still have insufficient cash-pay purchasing power.
How much does it cost to open a direct primary-care practice in California?
Startup costs depend on the facility, equipment, construction, staffing, technology, and working capital. The illustrative project in this article uses $600,000, but this is a hypothetical budget and not a statewide average.
How many patients are needed for a direct primary-care practice to break even?
The answer depends on the monthly contribution per member and the practice's fixed and variable expenses. The financial model should also account for provider capacity, debt service, and member retention.
Which California counties offer the best opportunities?
The answer requires a county-level and neighborhood-level analysis. High-income counties may offer greater purchasing power but also more competition and higher operating costs. Inland and rural counties may have significant healthcare need but lower ability to pay. No county should be recommended without evaluating both conditions.
Does a shortage of primary-care physicians mean a DPC practice will succeed?
No. A shortage indicates an access problem, not necessarily demand for a private membership. The practice must demonstrate an addressable customer base and a financially supportable service model.
Can an SBA loan finance a cash-pay medical practice?
Potentially. Eligible projects may qualify for SBA financing, depending on the program, use of proceeds, business structure, lender requirements, and repayment ability. SBA 7(a) and 504 financing have different purposes and restrictions.
Does a lender require a feasibility study?
Requirements vary by lender, loan program, project, and risk profile. A lender may request an independent study to evaluate market demand, competition, costs, and financial viability.
What should a California healthcare feasibility study include?
It should include market demand, demographic analysis, provider supply, shortage areas, competitor research, pricing, startup costs, operating expenses, financial projections, debt service, sensitivity analysis, and an independent conclusion.
Sources and Research References
Publication dates and data years differ; each is stated where known.
- California Department of Finance — County Population Estimates, 2020–2025 (E-2): https://dof.ca.gov/forecasting/demographics/estimates/e-2/
- California Department of Health Care Access and Information — Health Workforce Data: https://hcai.ca.gov/workforce/health-workforce/workforce-data/
- California Primary Care Shortage Areas — State Dataset: https://publish.data.ca.gov/dataset/primary-care-shortage-areas-in-california
- California Health Care Foundation — California Physicians Almanac 2025 (2023 data): https://www.chcf.org/resource/almanac/california-physicians/
- Let's Get Healthy California — Increasing Access to Healthcare Providers (2022 data): https://letsgethealthy.ca.gov/goals/redesigning-the-health-system/increasing-access-to-healthcare-providers/
- KFF — Primary Care Health Professional Shortage Areas (as of December 31, 2025): https://www.kff.org/other-health/state-indicator/primary-care-health-professional-shortage-areas-hpsas/
- U.S. Bureau of Economic Analysis — Personal Income by County (2024): https://bea.gov/data/income-saving/personal-income-by-county
- U.S. Census Bureau — County Population Estimates: https://www.census.gov/data/tables/time-series/demo/popest/2020s-counties-detail.html
- County Health Rankings — Primary Care Physicians (2025 release; 2021 data, AHRF/AMA); Median Household Income (SAIPE 2023); Uninsured (2022, under 65): https://www.countyhealthrankings.org/health-data/community-conditions/health-infrastructure/clinical-care/primary-care-physicians
- California Department of Public Health — County Health Status Profiles: https://www.cdph.ca.gov/Programs/CHSI/Pages/County-Health-Status-Profiles.aspx
- Health Resources and Services Administration — Health Workforce Shortage Areas: https://data.hrsa.gov/topics/health-workforce/shortage-areas
- Medical Board of California — Practice Information: https://www.mbc.ca.gov/Licensing/Physicians-and-Surgeons/Practice-Information/
- California Department of Managed Health Care: https://www.dmhc.ca.gov/
- American College of Physicians — Direct Patient Contracting: https://www.acponline.org/practice-career/business-resources/payment/delivery-and-payment-models/direct-patient-contracting
- Small Business Administration — 7(a) Loan Program: https://www.sba.gov/loans/7a-loans/
- Small Business Administration — 504 Loan Program: https://www.sba.gov/loans/504-loans/
- Bureau of Labor Statistics — Occupational Employment and Wage Statistics: https://www.bls.gov/oes/
- DPC Finder — California Direct Primary Care and Concierge Listings (commercial directory): https://www.tabflows.com/dpc-finder/california
Research limitations: County statistics are not necessarily from the same year. Provider counts may use different definitions, and commercial competitor directories may be incomplete. HPSA designation populations can overlap. The heat map discloses these limitations, shows source dates, and does not present estimates as verified facts.
Disclaimer: This article is for general market and business-planning information. Illustrative financial assumptions are not actual market averages, a loan commitment, a legal opinion, medical advice, or a guarantee of business performance.