
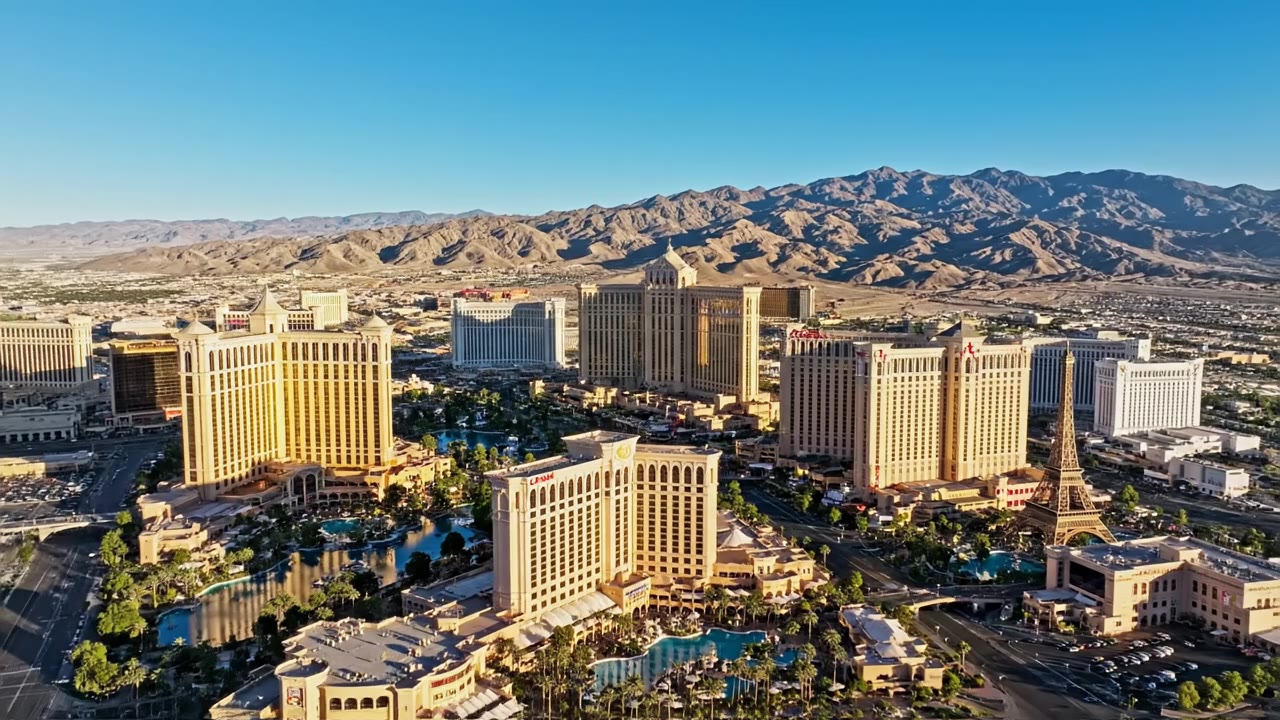
Las Vegas is not one uniform real estate market. Industrial lease-up, retail availability, office tenancy, apartment concessions and residential affordability move on different schedules. This report separates the published observations from the questions a lender or investor still needs to answer for a particular property.
01Economic Conditions and Demand Drivers
Employment and diversification
Colliers’ Q2 2026 regional report describes Southern Nevada annual job growth of 2.1% in May, with professional/business services, information and healthcare among the supporting sectors [1]. This is a dated regional observation, not a current statewide unemployment reading or a guarantee of future household formation. For a project, employment matters through the actual tenant, customer and commuting catchment—not merely the metro headline.
Population and job growth can support housing, service retail and industrial demand, but they do not establish a development’s achievable rents, absorption or construction budget. Verify the geography and vintage of each demand input and distinguish announced jobs from filled positions.
Tourism: the verified annual baseline
The Las Vegas Convention and Visitors Authority reported 38.5 million visitors in 2025, down 7.5% from 2024, alongside 6.0 million convention attendees. Annual hotel occupancy was 80.3%, average daily rate was $183.52, and RevPAR was $147.30 [2]. These are destination-level calendar-year measures; they should not be relabeled as 2026 results or applied directly to an individual hotel.
Convention activity, leisure travel and international visitation can diverge. A hotel feasibility model should use the relevant competitive set and monthly seasonality, then test changes in rate and occupancy together. The presence of major events does not eliminate price sensitivity or margin pressure.
Gaming and fiscal-period comparisons
Gaming win, hotel revenue and visitor spending are different measures. Statewide, Clark County, Strip and downtown series also represent different geographies. This review does not assert an unverified FY2026 gaming record. Any hospitality underwriting should obtain the dated Nevada Gaming Control Board series appropriate to the property and keep fiscal-year and calendar-year comparisons separate.
02Apex, Data Centers and Development Timing
Colliers identifies data-center expansion, advanced manufacturing and infrastructure investment as contributors to Southern Nevada’s diversification, including activity around Apex and other parts of the valley [1]. That establishes a research direction, not proof that every proposed site has tenants, financing or utility service.
A single aggregate “development pipeline” can combine completed projects, active construction, proposals and speculative announcements. This report does not assign an unsupported aggregate dollar value to that pipeline. For a competing-supply or demand analysis, record each project’s status, source date, financing, permits and expected delivery separately.
Data-center diligence requires more than acreage: confirm deliverable power, interconnection timing, redundancy, cooling design, water arrangements, fiber, zoning and tenant requirements. Land owned by a technology company is not the same as commissioned capacity. Proposed utility upgrades should be treated as dependencies until independently documented.
03Industrial, Warehouse and Distribution
CBRE’s Q2 2026 report recorded 825,000 square feet of positive net absorption, approximately 9.0% vacancy, nearly 1.3 million square feet delivered, and approximately 5.9 million square feet under construction [3]. Vacancy rose about 20 basis points quarter over quarter in that series; it was not uniformly declining.
| Measure | Reported observation | Interpretation limit |
|---|---|---|
| Total vacancy | Approximately 9.0% | Metro inventory; not a vacancy assumption for every submarket |
| Quarterly net absorption | +825,000 SF | Occupied-space change, not gross leasing volume |
| Quarterly deliveries | Nearly 1.3 million SF | Supply delivered during the quarter |
| Under construction | Approximately 5.9 million SF | Pipeline at the report date; not all immediately available |
Submarkets matter
CBRE attributes nearly three-fourths of quarterly absorption to North Las Vegas, while also identifying higher vacancy concentrations in North Las Vegas and Apex and tighter conditions in the Airport and Southwest submarkets [3]. Strong absorption and elevated vacancy can coexist where new supply is arriving. An “Apex is tight” blanket statement would obscure that distinction.
For warehouse or distribution space, compare clear height, loading, trailer parking, power and freeway access with the tenant’s needs. Small-bay owner-user space and bulk distribution have different competitive sets. A market average cannot substitute for current lease comparables or evidence of achievable tenant improvements and concessions.
Do not splice provider series
Colliers reports a different Q2 industrial absorption figure, 762,333 SF, and 9.1% vacancy in its own inventory [1]. Those figures need not contradict CBRE; they may reflect different coverage and methodology. Follow a single consistent series when measuring a trend, and explain any change in provider.
04Retail and Office
Retail: limited availability still needs site-level testing
Colliers reports 4.5% retail vacancy and five consecutive quarters of positive net absorption in Q2 2026 [1]. This supports a reading of comparatively limited availability within that surveyed inventory. It does not establish demand for every shopping center, drive-through pad or new development.
Underwrite the trade area, household spending, access, visibility, parking, co-tenancy, lease expirations and tenant credit. For a restaurant or drive-through concept, entitlement and circulation can be as decisive as market vacancy. Quoted base rent should be distinguished from operating-expense reimbursements and tenant-improvement obligations.
Office: improving occupancy, different survey universes
CBRE reports Q2 office vacancy of 11.9%, down from 12.1% in Q1, with approximately 8,000 SF of quarterly net absorption and average direct asking rent of $2.56 per SF per month, full-service gross [4]. That rent basis is not directly comparable to a triple-net retail or industrial quote.
Colliers reports 10.8% office vacancy for its own Q2 series [1]. The difference is material enough to disclose rather than combine into an unexplained range. Use building-class, location, lease-term and concession evidence for a property-specific conclusion. A flight to higher-quality space can improve one building while leaving another exposed.
05Multifamily and Apartments
Avison Young’s Q2 2026 report places average multifamily rent at $1,461 per unit, essentially flat quarter over quarter and down 1.4% year over year. It reports 708 units of net absorption, led by Henderson, Summerlin/Spring Valley and Enterprise/South Paradise [5].
| Measure | Reported observation |
|---|---|
| Average rent per unit | $1,461; down 1.4% year over year |
| Quarterly net absorption | 708 units |
| Quarterly sales volume | Approximately $287 million |
| Average transaction price | Approximately $231,000 per unit |
| Average transaction capitalization rate | 6.0% |
The transaction figures describe that report’s observed sales—not an appraisal, a guaranteed exit capitalization rate or a representative price for every property. Differences in property mix can change averages even when individual assets do not reprice by the same amount.
Pipeline contraction is not a guaranteed rent recovery
Avison Young describes elevated deliveries alongside a contracting development pipeline and slower new construction [5]. That can support rebalancing if demand persists, but it does not establish an exact 2027 delivery total or a guaranteed date for rent growth. No unsupported delivery forecast or market-wide concession percentage is assumed here.
For acquisitions and developments, reconcile in-place leases, economic occupancy, concessions, bad debt, turnover, renovation downtime and operating expenses. Model a slower lease-up and a flat-rent case before relying on a recovery. Market-level average rent is not the same as an asset’s effective collected rent.
06For-Sale Housing
Las Vegas REALTORS’ August 2026 figures, as reported by FOX5 on September 9, show a $475,000 median existing single-family closed-sale price, down 1.0% year over year. The median for condos and townhomes was $299,900. At month-end, 7,590 single-family homes and 2,714 condos/townhomes were listed without offers [6].
These are Southern Nevada MLS measures with specific property definitions—not all active listings, new-construction sales or a North Las Vegas median. The earlier $490,000 record reported for May and June should not be presented as August’s price. Likewise, listing-price series should not be substituted for closed-sale medians.
For a build-to-rent or for-sale project, compare attainable monthly housing costs, competing incentives, release schedules and cancellation risk. Household growth alone does not establish affordability at the proposed price. Stress absorption, financing costs and the time required to sell completed inventory.
07Land, Zoning and Availability
The Bureau of Land Management’s Southern Nevada Public Land Management Act (SNPLMA) program allows sales of public land within a defined Las Vegas-area boundary. BLM states that proceeds are allocated 5% to Nevada’s General Education Fund, 10% to the Southern Nevada Water Authority, and the balance to a special federal account for specified purposes [7].
That process is important to supply, but it does not mean every undeveloped parcel is federal, available for sale, buildable or entitled. This review does not publish an unverified percentage of Clark County controlled by BLM, a remaining-acreage total or a valley-wide finished-land price.
Compare land on the same development basis
Raw land, entitled land and finished lots carry different infrastructure, permitting, carrying-cost and execution obligations. Reconcile zoning, permitted density, title, access, utility capacity, drainage, geotechnical conditions, environmental constraints and improvement agreements. A low raw-land price can be outweighed by off-site costs or a long entitlement schedule.
Colliers reports 338.7 acres trading for $400.9 million in Q2 2026 [1]. That aggregate mixes transactions and is not a comparable sale for a particular parcel. It should not be converted into a “typical Las Vegas land price” without analyzing the underlying sites.
08Interactive Clark County Opportunity Heat Map
Choose an opportunity type, then select an area for evidence, practical next steps, risks and proceed-or-stop criteria. Switch to Whole county to explore Mesquite and Laughlin.
Warm zones have published local evidence; amber zones are conditional ideas; dashed blue zones need local research. These are approximate research areas—not predicted returns, investment ratings or property listings.
County outline: U.S. Census TIGERweb, simplified for display; not a survey. Research-zone centers and radii are approximate editorial orientation aids, not official submarket boundaries.
Prefer reading? Open the area playbooks below or see the sector evidence matrix.
Read all 10 area playbooks without using the map
Qualitative opportunity research, reviewed October 7, 2026. Broker commercial observations are Q2 2026; Mesquite and Laughlin tourism observations are August 2026 and January–August 2026; Boulder City context is 2022 retail sales and a July 1, 2025 population estimate, not current retail performance. Heat zones show approximate research areas, not measured returns, demand density, parcel boundaries or available properties. Colors distinguish published local signals (including declines), conditional ideas and missing current local operating evidence. They are not investment ratings. Uncolored land is not rated, not unavailable. Verify current conditions before acting.
North Las Vegas
Approximate industrial research center; not the city boundary or CBRE's exact submarket footprint.
Tenant-led industrial leasing or acquisition
Industrial & logistics · Published local signal
CBRE attributes nearly three-fourths of metro industrial net absorption to North Las Vegas in Q2 2026, while also identifying higher vacancy and substantial deliveries here. Absorption alone does not establish pricing power.
Sources: CBRE · Las Vegas Industrial (Q2 2026); Clark County · OpenWeb GIS (Parcel and planning lookup; check each layer's currency)
How to pursue it
- Shortlist existing buildings by a named tenant's clear-height, loading, yard, power and access requirements—not vacant square footage alone.
- Obtain current asking and signed net-effective lease comparables, concessions, competing availability and a verified tenant credit package.
- Negotiate acquisition or lease terms subject to physical inspection, environmental review and any required use approval.
- Underwrite lease-up delay, tenant improvements, commissions, rollover and debt-service coverage before making a binding commitment.
Risks
- New supply and vacancy can give tenants leverage.
- A large regional absorption figure can be concentrated in a few leases.
Proceed when: A verifiable tenant requirement fits the building, and conservative collected rent supports the full acquisition and improvement budget.
Walk away when: The plan depends on immediate occupancy, unsupported rent increases or an uncommitted anchor tenant.
Apex / northeast corridor
Approximate Apex orientation point; not a surveyed industrial-park boundary.
Pre-leased or owner-user industrial sites
Industrial & logistics · Conditional opportunity
CBRE reports higher industrial vacancy concentrations and notable Q2 2026 deliveries in Apex and North Las Vegas. That supports testing tenant-led sites, not assuming an immediate shortage.
Sources: CBRE · Las Vegas Industrial (Q2 2026); Clark County · OpenWeb GIS (Parcel and planning lookup; check each layer's currency)
How to pursue it
- Secure a tenant or owner-user requirement and define operational specifications.
- Request written utility capacity, connection cost and service timing; verify access and off-site obligations.
- Use a purchase option or diligence contingency while confirming jurisdiction, entitlements and environmental conditions.
- Bid infrastructure and construction, then size financing to a delayed-delivery and slower-lease-up case.
Risks
- Utility and off-site costs may exceed the apparent land discount.
- New supply can lengthen lease-up.
Proceed when: Documented utility delivery and tenant commitments support an independently costed development schedule.
Walk away when: Power, water, access or the intended user exists only as an assumption.
Power-qualified data-center site diligence
Data centers & power-ready sites · Conditional opportunity
Colliers discusses regional data-center and advanced-manufacturing expansion. This is a site-screening hypothesis, not evidence of energized capacity, a committed customer or data-center demand at this mapped point.
Sources: Colliers · Las Vegas Market Report (Q2 2026); Clark County · OpenWeb GIS (Parcel and planning lookup; check each layer's currency); Clark County · Zoning information (Current planning resource; city jurisdictions have their own approvals)
How to pursue it
- Obtain a utility study for deliverable megawatts, interconnection milestones and actual costs.
- Confirm redundant fiber, cooling/water strategy, land-use approval and environmental requirements with the responsible providers and jurisdiction.
- Qualify an operator or customer requirement before fixing building specifications.
- Make site control contingent on infrastructure evidence and stress delays, power costs and specialized-building residual value.
Risks
- A nearby transmission line does not establish service availability.
- Specialized improvements may have limited alternative use.
Proceed when: Utility, operator, permitting and financial evidence all support the same executable project.
Walk away when: The valuation depends on speculative power access or an unsigned customer expression of interest.
Airport / central south valley
Approximate airport-area research center; the zone is not airport-owned property or a broker boundary.
Infill logistics and owner-user space
Industrial & logistics · Published local signal
CBRE describes the Airport as a tighter industrial submarket than Apex and North Las Vegas in Q2 2026. No Airport-only vacancy rate or rent premium is assigned here.
Sources: CBRE · Las Vegas Industrial (Q2 2026); Clark County · OpenWeb GIS (Parcel and planning lookup; check each layer's currency)
How to pursue it
- Define the operator's actual delivery routes, loading, parking and operating-hour requirements.
- Inspect functional obsolescence, circulation and required building upgrades; confirm airport-related land-use or height restrictions where applicable.
- Compare acquisition-plus-upgrade cost with leasing genuinely comparable alternatives.
- Negotiate subject to use approval, environmental diligence and a funded capital-repair plan.
Risks
- A central location can still be operationally unsuitable.
- Older buildings can require material electrical, roof or fire-system upgrades.
Proceed when: Site operations work in practice and the all-in occupancy cost remains supportable after required upgrades.
Walk away when: Location is the only advantage and physical or regulatory constraints prevent the intended use.
Southwest valley
Approximate Southwest industrial research area, not an official submarket polygon.
Small-bay or tenant-matched industrial infill
Industrial & logistics · Published local signal
CBRE identifies Southwest as a tighter industrial submarket in Q2 2026. Small-bay positioning is an idea to validate with size-specific availability and tenant demand, not a measured finding in that report.
Sources: CBRE · Las Vegas Industrial (Q2 2026); Clark County · OpenWeb GIS (Parcel and planning lookup; check each layer's currency); Clark County · Zoning information (Current planning resource; city jurisdictions have their own approvals)
How to pursue it
- Survey available suites by size and collect evidence of actual tenant requirements.
- Check whether subdivision, parking, loading, fire access and utility metering support the proposed suite plan.
- Cost improvements and leasing commissions using written quotations.
- Base pricing on signed comparable leases and test a slower absorption case before construction or acquisition.
Risks
- Metro or submarket strength does not prove demand for a particular suite size.
- Subdivision costs can eliminate an apparent infill advantage.
Proceed when: Documented suite-level demand and realistic conversion costs support the proposal.
Walk away when: The only demand evidence is a broad market headline or broker optimism.
Henderson
Approximate orientation center; the reported apartment submarket is not the circle drawn here.
Existing apartments with verifiable operating upside
Multifamily housing · Published local signal
Avison Young reports 235 units of Q2 2026 net absorption in its Henderson submarket. Metro average rent was down 1.4% year over year; the report does not establish rent growth for a particular Henderson property.
Sources: Avison Young · Las Vegas Multifamily (Q2 2026; rolling report page); Clark County · OpenWeb GIS (Parcel and planning lookup; check each layer's currency)
How to pursue it
- Reconcile the seller's rent roll to collections, concessions, delinquency and trailing operating statements.
- Compare the property's unit mix, condition and location with competing properties and concessions.
- Scope only improvements supported by demonstrated tenant demand; cost vacancy and renovation downtime.
- Price against flat-rent, higher-expense and slower-stabilization cases, including reserves and financing costs.
Risks
- Physical occupancy can overstate economic performance.
- A regional rent average cannot justify a property's renovation premium.
Proceed when: Verified collections and a costed operating plan work without assuming a market rent rebound.
Walk away when: The purchase depends on immediate rent growth, understated concessions or deferred maintenance being ignored.
Needs-based retail or service-space leasing
Neighborhood retail · Conditional opportunity
Colliers reports 4.5% regional retail vacancy in Q2 2026. That is not a Henderson trade-area vacancy rate; local household spending, competition and tenant demand still need to be established.
Sources: Colliers · Las Vegas Market Report (Q2 2026); Clark County · OpenWeb GIS (Parcel and planning lookup; check each layer's currency)
How to pursue it
- Define a real drive-time trade area and map competing concepts, access and nearby occupied housing.
- Validate demand through prospective tenant discussions and current leasing comparables.
- Review use permissions, parking, signage, access, tenant improvement allowances and co-tenancy obligations.
- Seek supportable tenant commitments before construction; underwrite downtime and replacement leasing costs.
Risks
- Population growth does not guarantee tenant sales.
- Access, visibility and lease obligations can dominate a broad vacancy signal.
Proceed when: A credible tenant can support sustainable occupancy costs in the actual trade area.
Walk away when: The thesis relies only on nearby rooftops or the metro vacancy headline.
Summerlin / Spring Valley
Illustrative combined research area; neighborhood, city and provider boundaries differ.
Selective apartment acquisition and repositioning
Multifamily housing · Published local signal
Avison Young reports 201 units of Q2 2026 absorption in its combined Summerlin/Spring Valley submarket. This observation does not establish which neighborhood or property generated the demand.
Sources: Avison Young · Las Vegas Multifamily (Q2 2026; rolling report page); Clark County · OpenWeb GIS (Parcel and planning lookup; check each layer's currency)
How to pursue it
- Separate the candidate's true competitive set from the combined submarket average.
- Verify collected rent, renewals, concessions and retention by unit type.
- Test whether any proposed amenity or interior work produces supportable incremental rent after downtime and costs.
- Negotiate diligence contingencies and fund reserves for flat rents, insurance, taxes and major repairs.
Risks
- A combined reporting area can conceal materially different neighborhoods.
- Renovation costs do not automatically translate into achievable rent increases.
Proceed when: Property-specific operating evidence supports the basis without relying on a premium neighborhood label.
Walk away when: The asking price capitalizes unverified renovation premiums or ignores the actual competitive set.
Enterprise / South Paradise
Approximate combined research center; includes neither all land nor all neighborhoods in the reported submarket.
Apartment lease-up or acquisition screening
Multifamily housing · Published local signal
Avison Young reports 195 units of Q2 2026 absorption in Enterprise/South Paradise. Regional deliveries remained elevated; project-level competing supply and attainable effective rents remain essential.
Sources: Avison Young · Las Vegas Multifamily (Q2 2026; rolling report page); Clark County · OpenWeb GIS (Parcel and planning lookup; check each layer's currency)
How to pursue it
- Map delivered, under-construction and genuinely financed competitors separately.
- Survey concessions, effective rents and lease-up by directly comparable unit type.
- Build a monthly absorption and operating-deficit budget with slower stabilization.
- Align loan maturity, reserves and equity commitments with the stressed stabilization date.
Risks
- An attractive rent quote may exclude concessions.
- Construction competition can extend operating deficits.
Proceed when: Independent competitive evidence supports attainable rents and funded reserves cover a delayed lease-up.
Walk away when: The financing runs out before a supportable stabilization date.
Entitlement-led residential or build-to-rent feasibility
Land & residential development · Conditional opportunity
The BLM SNPLMA framework and Clark County planning tools inform land diligence. They do not establish that a mapped site is for sale, entitled, serviced or suitable for housing.
Sources: BLM · SNPLMA land program (Program framework checked October 7, 2026); Clark County · OpenWeb GIS (Parcel and planning lookup; check each layer's currency); Clark County · Zoning information (Current planning resource; city jurisdictions have their own approvals)
How to pursue it
- Identify a specific parcel and legal owner; distinguish private offerings from officially announced federal sales.
- Confirm the responsible jurisdiction, permitted density, access, title, drainage, soils and utility service obligations.
- Request a pre-application discussion and independently cost all off-site improvements and carrying costs.
- Test for-sale and rental alternatives against local affordability and documented absorption; use contingent site control where available.
Risks
- Raw land is not equivalent to a finished, buildable lot.
- A federal program does not make an individual parcel available.
Proceed when: Parcel-level approvals, service costs and an achievable product/price support the complete residual-land calculation.
Walk away when: The seller's density, infrastructure schedule or future land value has not been verified.
Boulder City
Community reference point only; no rated investment area or property offering is implied.
Local-service retail feasibility research
Neighborhood retail · Local evidence needed
Census QuickFacts for Boulder City city, Nevada (FIPS 3206500) reports 2022 total retail sales of $110.484 million (110,484 in the source's $1,000 units) and a July 1, 2025 resident population estimate of 14,884 (V2025). Retail sales cover Economic Census retail trade establishments (NAICS 44–45), net of refunds and excluding sales taxes collected for government; this is not a monthly taxable-sales series or resident spending estimate. These are dated city-level context, not 2026 tenant sales or proof of unmet demand. No current Boulder City retail vacancy or absorption series was verified in this review, so local operating evidence is still needed. Neither Las Vegas metro retail data nor Boulder Strip gaming revenue is a Boulder City measure.
Sources: U.S. Census · Boulder City city, Nevada, QuickFacts (FIPS 3206500) (2022 retail sales; July 1, 2025 population (V2025); checked October 7, 2026); U.S. Census · Retail sales definition, NAICS 44–45 (2022 Economic Census; five-year census, not monthly taxable sales); U.S. Census · Resident population estimate definition (Population Estimates Program, V2025; not visitor counts); Clark County · OpenWeb GIS (Parcel and planning lookup; check each layer's currency)
How to pursue it
- Build a local inventory of occupied and vacant comparable premises, with current lease terms and tenant sales where available; do not extrapolate 2022 city totals into a store forecast.
- Interview qualified prospective operators and test resident and visitor demand separately; a resident population estimate does not measure visitor spending or a site's trade area.
- Confirm city-specific development, use and growth controls directly with Boulder City.
- Proceed to property underwriting only after obtaining local operating evidence and current cost quotations.
Risks
- Historical citywide retail sales do not establish current sales growth, vacancy, spending leakage or demand for a particular store.
- Visitor activity is not proof of sustainable year-round sales.
- Municipal rules may materially constrain a proposed use.
Proceed when: Current local evidence and city approvals establish a supportable operating case.
Walk away when: The operating case depends on a Las Vegas-wide statistic, an assumed visitor spillover or treating 2022 retail sales as current demand.
Mesquite
Community reference point; not a hospitality market boundary.
Visitor-service or lodging concept research
Hospitality & visitor services · Published local signal
LVCVA's Mesquite rows report August 2026 estimated visitor volume of 53,000 (down 22.1% versus August 2025), total occupancy of 46.3% (down 15.4 percentage points), average daily room rate (ADR) of $89.15 and revenue per available room (RevPAR) of $41.28 (down 24.4%). January–August 2026 YTD visitor volume was 535,000 (down 7.1% versus the same 2025 period), with 59.8% total occupancy. These are Mesquite destination aggregates, not Las Vegas figures or a property's competitive set. Visitors are estimates, not room nights; ADR and RevPAR are room measures, not total resort revenue or profit. The local declines support downside testing, not a shortage or investment-return claim.
Sources: LVCVA · Mesquite tourism indicators, page 2 (August 2026 and January–August 2026 YTD; Mesquite rows only; checked October 7, 2026); Clark County · OpenWeb GIS (Parcel and planning lookup; check each layer's currency)
How to pursue it
- Obtain a current local hotel or visitor-service competitive set with monthly operating history and reconcile it to the dated LVCVA Mesquite series.
- Separate weekday/weekend demand, seasonality and demand drivers; do not annualize August alone or replace the monthly observation with the YTD average.
- Confirm Mesquite zoning, licensing, utility and improvement requirements for the exact site.
- Cost the concept and stress occupancy, room-rate and RevPAR weakness before seeking property control or financing.
Risks
- Small markets can depend heavily on specific events or operators.
- Destination averages can mask property differences; LVCVA's stated survey coverage of more than 75% applies to Las Vegas inventory, not a verified Mesquite coverage rate.
- One month's decline is not a full-year forecast; sampling and participant changes can affect comparisons.
Proceed when: A defensible local demand study and costed concept support the proposal.
Walk away when: Regional Las Vegas figures or Mesquite destination averages are substituted for the subject's operating evidence, or the case requires an unsupported immediate recovery.
Laughlin
Community reference point on the Nevada side of the Colorado River.
Hospitality repositioning and service-concept diligence
Hospitality & visitor services · Published local signal
LVCVA's Laughlin rows report August 2026 estimated visitor volume of 118,000 (down 11.9% versus August 2025), total occupancy of 45.2% (down 8.5 percentage points), average daily room rate (ADR) of $63.54 and revenue per available room (RevPAR) of $28.72 (down 23.2%). January–August 2026 YTD visitor volume was 1,030,000 (up 3.7% versus the same 2025 period), with 50.4% total occupancy. The positive YTD visitor comparison does not negate August room-performance weakness. These are Laughlin destination aggregates, not Las Vegas or Bullhead City hotel observations, a property comp set or an available listing. Visitors are estimates, not room nights; ADR and RevPAR are room measures, not gaming revenue, total resort revenue or profit.
Sources: LVCVA · Laughlin tourism indicators, page 2 (August 2026 and January–August 2026 YTD; Laughlin rows only; checked October 7, 2026); Clark County · OpenWeb GIS (Parcel and planning lookup; check each layer's currency); Clark County · Zoning information (Current planning resource; city jurisdictions have their own approvals)
How to pursue it
- Obtain local monthly competitive operating history, reconcile it to the dated LVCVA Laughlin series and separate gaming, rooms and other revenue where relevant.
- Inspect deferred maintenance and obtain a complete capital plan before valuing a repositioning.
- Confirm jurisdiction, licenses, use approvals and any property-specific flood or environmental constraints.
- Test operator capability, seasonality, downside cash flow and financing reserves; do not annualize August or assume YTD visitor growth raises room revenue.
Risks
- Renovation downtime and required capital can overwhelm an apparently low acquisition price.
- Destination averages can mask property differences; LVCVA's stated survey coverage of more than 75% applies to Las Vegas inventory, not a verified Laughlin coverage rate.
- One month's decline is not a full-year forecast; sampling and participant changes can affect comparisons.
Proceed when: Independent local demand evidence, operator capability and a fully funded capital plan agree.
Walk away when: Regional tourism headlines or YTD visitor growth substitute for the subject's room revenue, cash flow or required licenses.
Sector Evidence and Diligence Matrix
This qualitative matrix summarizes the evidence above and the remaining underwriting questions. It is not a numerical investment ranking. There is no validated basis in this article for assigning each sector a 1-to-5 return or opportunity score.
| Segment | Observed context | Key diligence |
|---|---|---|
| Industrial / distribution | Positive Q2 absorption alongside continuing deliveries [1, 3] | Relevant submarket vacancy, functional fit, effective lease terms |
| Data centers | Expansion activity identified in regional research [1] | Committed utility capacity, tenant requirements, permits and timing |
| Retail | Low vacancy in Colliers’ Q2 surveyed inventory [1] | Trade area, tenant credit, access, entitlement and occupancy cost |
| Office | Occupancy improving; provider series differ [1, 4] | Building class, concessions, tenant rollover and capital expenditure |
| Multifamily | Positive absorption; average rent below prior year [5] | Collected rent, concessions, new competition and operating margin |
| For-sale / build-to-rent housing | August resale median below the earlier record [6] | Affordability, incentives, absorption and exit alternatives |
| Land | Active transactions and a defined federal disposal process [1, 7] | Entitlement, utilities, off-site costs and comparable parcel basis |
| Hospitality | 2025 annual visitation below 2024 [2] | Current competitive set, monthly seasonality and operating costs |
09Turning a Market Observation into a Testable Thesis
A useful opportunity thesis identifies both the evidence and the condition that would invalidate it. Positive industrial absorption is relevant, but a competing delivery next to the site could change achievable rent. Low retail vacancy is relevant, but weak access or an unsuitable trade area can still impair a pad. A contracting apartment pipeline is relevant, but delayed absorption or expense inflation can postpone any improvement in cash flow.
For each proposal, build a base case from supportable current evidence and separate upside assumptions from it. Test a slower lease-up, lower effective rent, higher construction or operating costs, a delayed utility connection and a more expensive refinancing. Identify required additional capital and who bears it under the agreements.
No sector in this report is designated a buy, sell or hold recommendation. Public metro data supports screening; it does not replace current comparables, verified site conditions, financing terms or independent project analysis.
10Feasibility Studies and Ongoing Monitoring
Market research and project feasibility answer different questions
A market report describes the competitive environment. A feasibility study examines whether a defined project can operate and meet its obligations under documented assumptions and stress cases. An appraisal addresses a separately scoped valuation question. These reports should not be presented as interchangeable or as universally required by every lending program.
Wert-Berater’s Market Risk Intelligence offering and custom market research are commissioned, analyst-prepared services. Scope, property family, geography, available evidence and delivery are confirmed for the assignment. This public-source blog is not a licensed property database, a scored MRI deliverable or proof of universal market coverage.
From underwriting to actual performance
Asset and portfolio performance monitoring compares actual results with an agreed baseline and identifies changes in coverage, operating performance and relevant risks. An engagement can include updated market evidence and sensitivities, but frequency, inputs and deliverables depend on the scope. A sponsor update, an independent analytical review and an audit provide different levels and kinds of assurance.
Financial models should distinguish documented inputs from formulas and flag missing or provisional evidence. Monitoring does not guarantee repayment or an investor return, and independence should be described through the actual engagement responsibilities—not an unsupported blanket fiduciary-duty claim.
Underwrite the property, not the metro average
Discuss a Southern Nevada market-research, feasibility or monitoring assignment based on the evidence your project requires.
Discuss Your ProjectPerformance Monitoring11Frequently Asked Questions
What is Las Vegas industrial vacancy in this report?
CBRE reports approximately 9.0% for Q2 2026; Colliers reports 9.1% for its own inventory. The article keeps these series separate rather than treating them as interchangeable.
What does the report say about Las Vegas apartment rents?
Avison Young reports average rent of $1,461 per unit in Q2 2026, down 1.4% year over year, and 708 units of net absorption. These are market observations, not a forecast for a particular property.
What was the Southern Nevada resale home median in August 2026?
Las Vegas REALTORS figures reported by FOX5 show $475,000 for existing single-family homes sold through the MLS and $299,900 for condos and townhomes. Those closed-sale measures are not listing prices.
Does the opportunity heat map rank investments?
No. Its colors distinguish published local signals, conditional ideas and areas needing current local operating evidence. Mesquite and Laughlin have separately reported LVCVA lodging and visitor observations, including declines; a documented signal is not a positive investment rating. Boulder City has dated Census retail and resident-population context but still needs current retail operating evidence. The zones are approximate research locations, not parcel or broker submarket boundaries, available listings or predicted returns. Select an area for sources, opportunity types, practical diligence steps and proceed-or-stop criteria. The accompanying matrix summarizes sector evidence without assigning numerical investment scores.
Are all figures current to October 2026?
No. The article was reviewed in October, but each observation retains its actual source period: principally Q2 2026 commercial data, August 2026 housing data and full-year 2025 regional tourism data. The map adds August 2026 and January–August 2026 YTD LVCVA observations for Mesquite and Laughlin, plus 2022 retail sales and a July 1, 2025 resident population estimate (V2025) for Boulder City. The older Census retail total is not a 2026 operating measure. Local source links and limitations appear in each playbook.
12Sources and Methodology
Sources checked October 7, 2026. Only the expressly attributed observations are reproduced; no national series is substituted for missing local evidence. The FOX5 item is secondary reporting of Las Vegas REALTORS data. Linked rolling report pages may later display newer editions; the quoted vintage here remains the one stated.
- Colliers — Las Vegas Market Report, Q2 2026, July 6, 2026. Regional employment context, retail, alternative industrial/office series and land transactions.
- LVCVA — 2025 annual tourism results, January 29, 2026. Visitor volume, conventions, occupancy, ADR and RevPAR.
- CBRE — Las Vegas Industrial Figures, Q2 2026, July 8, 2026. Vacancy, absorption, deliveries, pipeline and submarket observations.
- CBRE — Las Vegas Office Figures, Q2 2026, July 8, 2026. Vacancy, absorption and full-service-gross asking rent.
- Avison Young — Las Vegas Multifamily Market Report, Q2 2026. Rent, absorption and observed transaction figures.
- FOX5 — Las Vegas REALTORS’ August housing results, September 9, 2026. MLS closed-sale medians and listings without offers.
- BLM — Southern Nevada Public Land Management Act. Disposal boundary framework and proceeds allocation.
General educational information only, not investment, tax, legal, lending or real-estate advice. This report is not an offer, solicitation, appraisal or guarantee of performance. Market statistics vary by coverage, definition and period. Project decisions require current, independent, property-specific analysis. Wert-Berater does not arrange, broker or place debt or equity and makes no buy, sell or hold recommendation here.